
Purpose
The purposes of this study were to develop a prediction model for pressure injury using a machine learning algorithm and to integrate it into clinical practice.
Methods
This was a retrospective study of tertiary hospitals in Seoul, Korea. It analyzed patients in 12 departments where many pressure injuries occurred, including 8 general wards and 4 intensive care units from January 2018 to May 2022. In total, 182 variables were included in the model development.
A pressure injury prediction model was developed using the gradient boosting algorithm, logistic regression, and decision tree methods, and it was compared to the Braden scale.
Results
Among the 1,389,660 general ward cases, there were 451 cases of pressure injuries, and among 139,897 intensive care unit cases, there were 297 cases of pressure injuries. Among the tested prediction models, the gradient boosting algorithm showed the highest predictive performance. The area under the receiver operating characteristic curve of the gradient boosting algorithm's pressure injury prediction model in the general ward and intensive care unit was 0.86 (95% confidence interval, 0.83~0.89) and 0.83 (95% confidence interval, 0.79~0.87), respectively. This model was integrated into the electronic health record system to show each patient's probability for pressure injury occurrence, and the risk factors calculated every hour.
Conclusion
The prediction model developed using the gradient boosting algorithm exhibited higher performance than the Braden scale. A clinical decision support system that automatically assesses pressure injury risk allows nurses to focus on patients at high risk for pressure injuries without increasing their workload.
The purposes of this study were to develop a prediction model for pressure injury using a machine learning algorithm and to integrate it into clinical practice.
This was a retrospective study of tertiary hospitals in Seoul, Korea. It analyzed patients in 12 departments where many pressure injuries occurred, including 8 general wards and 4 intensive care units from January 2018 to May 2022. In total, 182 variables were included in the model development. A pressure injury prediction model was developed using the gradient boosting algorithm, logistic regression, and decision tree methods, and it was compared to the Braden scale.
Among the 1,389,660 general ward cases, there were 451 cases of pressure injuries, and among 139,897 intensive care unit cases, there were 297 cases of pressure injuries. Among the tested prediction models, the gradient boosting algorithm showed the highest predictive performance. The area under the receiver operating characteristic curve of the gradient boosting algorithm's pressure injury prediction model in the general ward and intensive care unit was 0.86 (95% confidence interval, 0.83~0.89) and 0.83 (95% confidence interval, 0.79~0.87), respectively. This model was integrated into the electronic health record system to show each patient's probability for pressure injury occurrence, and the risk factors calculated every hour.
The prediction model developed using the gradient boosting algorithm exhibited higher performance than the Braden scale. A clinical decision support system that automatically assesses pressure injury risk allows nurses to focus on patients at high risk for pressure injuries without increasing their workload.
A Pressure Injury (PI) is a localized injury to the skin and underlying tissues, resulting from sustained pressure or shear force [1]. PIs not only delay total functional recovery but also prolong hospitalization and increases medical costs due to extended stays [1]. The areas affected by a PI are prone to bacterial colonization, which can increase the risk of patient mortality [2]. In the United States, the incidence rate of PIs among inpatients has been reported at 15.1% [3]. In Korea, the incidence rates are approximately 23% in General Wards (GWs) and 30% in Intensive Care Units (ICUs) [4, 5].
PI progression can impede patient functional recovery and prolong hospital stays [1]. Therefore, the Joint Commission International, a quality assessment organization for medical institutions, along with the Korea Medical Institution Evaluation and Certification Institute, mandates that medical institutions implement an evidence-based PI prevention management system [6].
The basis of PI prevention and management lies in assessing the risk of PI using reliable, standardized tools, identifying risk groups likely to develop PI, and implementing preventive interventions. The scales currently employed in clinical settings include the Norton scale, developed in 1962 [7], the Waterlow scale, developed in 1985 [8], and the Braden scale, developed in 1987 [9]. The Norton scale, originally developed as a PI risk assessment tool, evaluates five factors: general physical condition, mental status, activity, mobility, and incontinence. However, a systematic review indicated that this scale has low reliability [10]. The Waterlow scale assesses various factors, including Body Mass Index (BMI), skin condition, gender, and age. Despite its comprehensive approach, it is infrequently used in clinical practice due to its low specificity and the increased workload it places on nurses, who must manage many patients not at risk for PI as though they were in high-risk groups [10]. The Braden scale, which was designed to assess PI risk in hospitalized patients, is the most commonly used in clinical practice.
Nurses use the Braden scale to assess each patient's risk of PI, identifying high-risk groups and implementing preventive interventions. However, the effectiveness of the Braden scale has been questioned. Studies have shown variability in its sensitivity and specificity depending on the patient population targeted [11], and different cutoff points have been suggested for identifying at-risk groups [12]. Consequently, relying solely on the Braden scale to estimate the risk of PI may be insufficient [13]. Additionally, assessing the risk of PI requires consideration of complex risk factors, including sensory perception, moisture, nutrition, vascular disease or diabetes, and albumin levels [14]. The Braden scale, however, evaluates only six factors: sensory perception, moisture, activity, mobility, friction, and shear. This limitation means that it does not encompass all necessary risk factors. Moreover, the subjective nature of the risk assessment conducted by nurses can lead to reliability issues among individuals. Studies have reported a low level of agreement, with scores ranging from 0.29 to 0.37, between Wound, Ostomy, and Continence Nursing (WOCN) specialists and general nurses [15, 16].
To surmount the limitations of the Braden scale, recent methods have been proposed to develop models that predict the risk of developing PIs by utilizing various data from Electronic Health Records (EHRs) that influence the occurrence of PI [16]. Additionally, leveraging the data accumulated in these EHRs and integrating it into the clinical decision support system can enhance the efficiency and quality of nursing care [17, 18].
However, the previous models have several limitations. One study developed a prediction model based on Cox regression analysis; nonetheless, it was limited by a small sample size of only 149 patients, all of whom had respiratory diseases. Furthermore, although complex risk factors are necessary to assess the risk of PIs, this study only used age, gender, albumin, hemoglobin, and C-reactive protein as variables [19]. In other research, models were specifically developed for patients in the ICU [20]. However, PIs can occur outside the ICU as well, and these models are difficult to implement in clinical practice, where patients often move between the ICU and GW. Additionally, while previous studies developed models and assessed their sensitivity and specificity by comparing them with traditional tools like the Braden scale, they were not actually implemented in clinical settings [16, 17, 20].
Therefore, to address these issues, we developed a PI prediction model using a machine learning algorithm across ten nursing departments in the GW and ICU. The model was validated by comparing its performance with the Braden scale and other machine learning algorithms before being integrated into clinical practice.
This was a retrospective case-control study aimed at developing a model to predict the occurrence of PIs using EHRs. We created a model employing machine learning algorithms, validated it by comparing it to the Braden scale and other machine learning algorithms, and then integrated it into clinical practice.
This retrospective study was conducted at an urban tertiary hospital in Korea, involving approximately 2,000 inpatients. The GWs and ICUs with the highest incidence of PIs over the past five years were selected as the focus of the study. The development of a prediction model for PI aimed to facilitate rapid prediction and intervention for patients at risk, thereby reducing the occurrence of PI. Consequently, these specific wards and units were chosen for the study. Patients admitted to eight GWs and four ICUs from January 2018 to May 2022 were included in the study. The eight GWs consisted of a transplant surgery unit, a respiratory internal medicine unit, two cardiothoracic surgery units, two gastroenterology units, and two hematology units. The four ICUs were divided into two internal medicine ICUs and two surgical ICUs.
The dataset was constructed by extracting data from EHRs. To verify the quality of the constructed data, samples were randomly selected, and the values of factors associated with the presence and occurrence of PIs were compared with the information recorded in the EHRs.
All patients admitted to eight GWs and four ICUs from January 2018 to May 2022 were included. Each hospitalization was treated as an independent case if a patient was admitted two or more times during the study period. Patients under the age of 18 years and those with a hospital stay shorter than 24 hours or a previous PI were excluded from the study.
For statistical analysis, Python version 3.8.2 (Python Software Foundation, Wilmington, DE, USA) was used. Continuous variables are presented as means and standard deviations. Categorical variables are described as the frequencies and percentages. We used the t-test and χ2 test to calculate p-values, and a p-value <.05 was considered statistically significant.
This study was approved by the institutional review board (IRB) prior to data collection (Approval SMC no. 2021-04-135-001). The requirement to obtain informed consent from the research subjects was exempted by the IRB due to the retrospective nature of the study, and all personal information that could identify the subjects was deleted or encrypted when the data were extracted.
We initially collected 158 predictor variables potentially influencing the development of PI, based on the National Pressure Ulcer Advisory Panel guidelines [1] and the subjective opinions of two WOCN specialists. These specialists confirmed the relevance of the variables mentioned in the guidelines to PI and verified their documentation in the EHRs to facilitate variable selection.
Demographic information included age, gender, medical department, and length of ICU stays. Variables related to the patient's disease encompassed the presence or absence of urinary disturbance, sensory perception impairment, smoking history, BMI, and the Richmond Agitation Sedation Scale (RASS) score. Additionally, the Korean Patient Classification System (KPCS) score and group were included. Laboratory data comprised variables such as albumin, hemoglobin, and lactic acid. We also recorded the use of medical devices, including nasal cannulas, masks, braces, splints, and Foley catheters.
Predictor variables associated with the occurrence of PI were collected at various time points and recorded in the EHRs. The extraction of data varied depending on the format of the record, leading to its categorization into three groups. The first category includes variables such as gender, urinary disturbance, sensory perception impairment, and smoking history, which are collected only once during hospitalization. For instance, smoking history is documented at the time of hospitalization on the nursing information survey and used as recorded. The second category consists of variables recorded multiple times in the same format, such as weight, BMI, RASS, KPCS, and laboratory data. For these, the most recent value recorded within the last 24 hours was utilized. The third category includes variables like stool frequency and drug dosage, which are considered based on the number of occurrences within 24 hours. Additionally, the use of medical devices was monitored to determine if there was at least one record of application within the same 24-hour period. For the KPCS score, any missing values were replaced with the most recent non-missing value. Other missing values were not substituted and were used as-is in the development of the model.
To utilize patient test results such as hemoglobin, platelets, and albumin as variables, we defined 24 derived variables by categorizing them into normal and abnormal values. For instance, the albumin levels were segmented into three ranges: less than 3.5 g/dL, between 3.5 and 5.2 g/dL, and greater than 5.2 g/dL. Ultimately, we employed a total of 182 predictor variables, with a comprehensive list of these variables provided in Table 1.
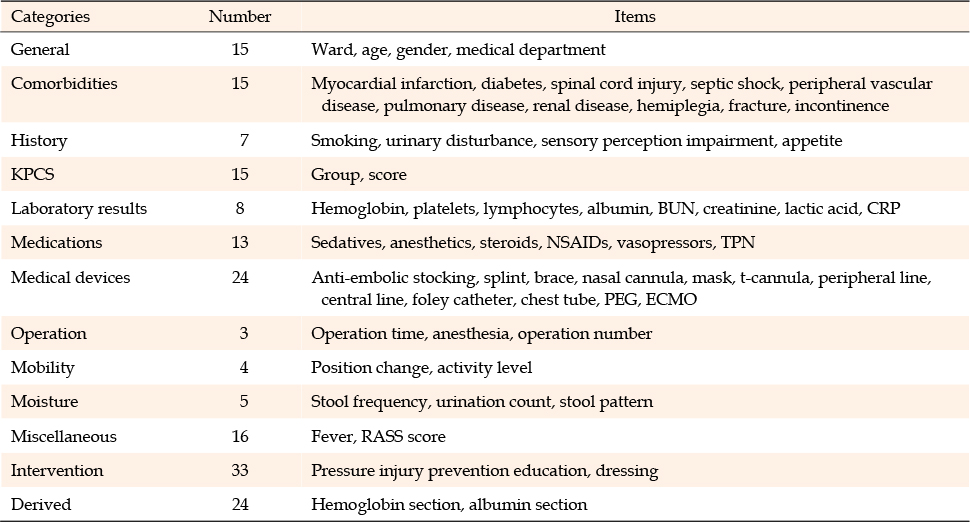
Table 1
Variables Used in the Algorithm
The PI group consisted of patients whose EHR indicated a "hospital-acquired PI wound" in the PI occurrence report during their hospital stay. If a patient developed multiple PIs, only the first occurrence was included in our analysis.
This study assessed the risk of a hospitalized patient developing their first PI. It is important to note that the methodology may not be suitable for evaluating the risk of multiple PIs in a single patient. However, patients who have already developed a PI are generally considered high-risk and receive ongoing management. Consequently, the study incorporated an override rule that treated any patient who has developed a PI as high-risk until discharge. This approach is further detailed in the Clinical Practice Integration section.
The development cohort, comprising patients from January 2018 to December 2020, was utilized to develop the prediction model. The validation cohort, which included patients from January 2021 to May 2022, was employed to optimize the hyper-parameters of the model. The performance metric of the final model was calculated based on the test cohort.
Separate PI prediction models were developed for patients in the GW and the ICU due to their differing characteristics and varying conditions and severity levels. The design ensures that when a patient is in the GW, the GW prediction model is used for assessments, and when the patient is transferred to the ICU, the ICU prediction model is applied. These predictive models are versatile and can be utilized as patients transition between locations.
The PI prediction model was developed using gradient boosting algorithm, logistic regression, and decision trees. Logistic regression and decision trees are among the most common statistical models and have been widely used in previous studies [17, 18, 19, 20]. The gradient boosting algorithm is one of the most commonly used algorithms in machine learning, enabling the automatic discovery of complex data structures, including nonlinearities and higher-order interactions, even with thousands of potential predictors [21]. Additionally, other studies in the medical field have demonstrated that among various machine learning techniques, gradient boosting algorithms exhibit high performance and have been extensively utilized in machine learning development [22].
To select an appropriate prediction model, we compared the performance of each model. We evaluated the predictive performance of three prediction models and the Braden scale by determining their sensitivity, specificity, positive predictive value, and negative predictive value. Additionally, we calculated the Area under the Receiver Operating Characteristic (AUROC) values for each model. The gradient boosting algorithm demonstrated the highest AUROC value. Therefore, we decided to use the gradient boosting algorithm to develop our prediction model.
After selecting the gradient boosting algorithm with the optimal measurement value, we calculated the individual contributions of each variable. These calculations were conducted to elucidate the relationships between independent and dependent variables within the model. Variables that did not yield results were removed to improve the accuracy of the findings.
Clinical practice integration was implemented to improve work efficiency by intuitively presenting the patient's PI risk to nurses. The predicted probability of PI was clearly displayed in the EHRs. Based on the predetermined cutoff value, patients were categorized as either high-risk or non-high-risk for PI. The cutoff for this model was established by analyzing data in accordance with the hospital's policy, taking into account both sensitivity and specificity to ensure the application of a model with high predictive power.
Additionally, to effectively inform patients about their high-risk of PIs and facilitate appropriate intervention activities, the screen displayed PI risk factors. These factors represent a collection of predictor variables used in the model discussed above. Given the impracticality of displaying all 182 predictor variables, they are presented in this grouped format.
Risk factors were identified from 14 PI assessment tools, including the Braden scale, Norton scale, and Waterlow scale, as well as from existing guidelines and literature reviews. WOCN specialists and nine nursing unit managers assessed the validity of the risk factors for each instrument. Only those risk factors with a content validity index of 0.90 or higher were classified, resulting in five final categories: immobility, moisture, nutrition, tissue perfusion, and device-related factors.
Each risk factor was directly correlated with one of the 182 predictor variables used in the model. For instance, stool frequency and stool pattern were associated with the moisture risk factor, while fasting status and albumin level corresponded to the nutrition factor. The significance of each risk factor category is determined based on the contribution of its respective predictor variables.
Nurses can intuitively determine whether to manage a patient as PI high-risk or non-high-risk based on the status displayed in the EHR. They can access not only the high-risk status but also probability values and risk factors. This enables nurses to review the identified risk factors and implement PI prevention interventions tailored to the patient's specific condition.
Even if the prediction model does not classify a patient as high-risk, the nurse's assessment is recorded in text format to ensure the patient is managed as part of the high-risk group. In clinical settings, probability values are updated and displayed hourly to promptly address changes in a patient's condition. However, if a patient's classification as high-risk for PI changes every hour, it may lead to confusion among nurses. When a patient is identified as high-risk for PI, preventive measures such as altering the patient's position or educating them about PI prevention and management are recommended. Nonetheless, frequent changes in the high-risk status can create uncertainty about whether to implement these preventive interventions.
Therefore, we implemented policy-level override rules to manage the classification of patient risk. If the prediction model indicated a high-risk probability more than once in a single day, the patient was considered high-risk for the entire day. Patients identified with PI were maintained in the high-risk category until their discharge. Furthermore, if a patient's risk status was high for three consecutive days, they were still considered high-risk, even if their risk level dropped on the fourth day. This policy was established to reduce the nursing workload associated with transitioning a patient from a non-high-risk to a high-risk category for PI. For instance, when a patient is categorized as high-risk for PI, nurses are required to educate the patient on PI prevention and to ensure that the patient changes positions regularly.
Between January 2018 and May 2022, there were 1,502,311 GW cases and 148,326 ICU cases. Following the application of exclusion criteria, 112,651 GW cases were removed, leaving 1,389,660 cases for the final analysis (451 in the PI group and 1,389,209 in the non-PI group). Similarly, 8,429 ICU cases were excluded based on the same criteria, resulting in 139,897 cases for analysis (297 in the PI group and 139,600 in the non-PI group).
Due to the distinct characteristics and varying severity levels between GW and ICU patients, separate prediction models were developed. The baseline characteristics of each patient group are presented in Table 2. The PI group contained a higher proportion of men and elderly patients. Additionally, patients in the GW PI group experienced longer hospital stays. Furthermore, the PI group exhibited poorer Laboratory result compared to the non-PI group. For instance, BUN and lactic acid levels were elevated in the PI group.
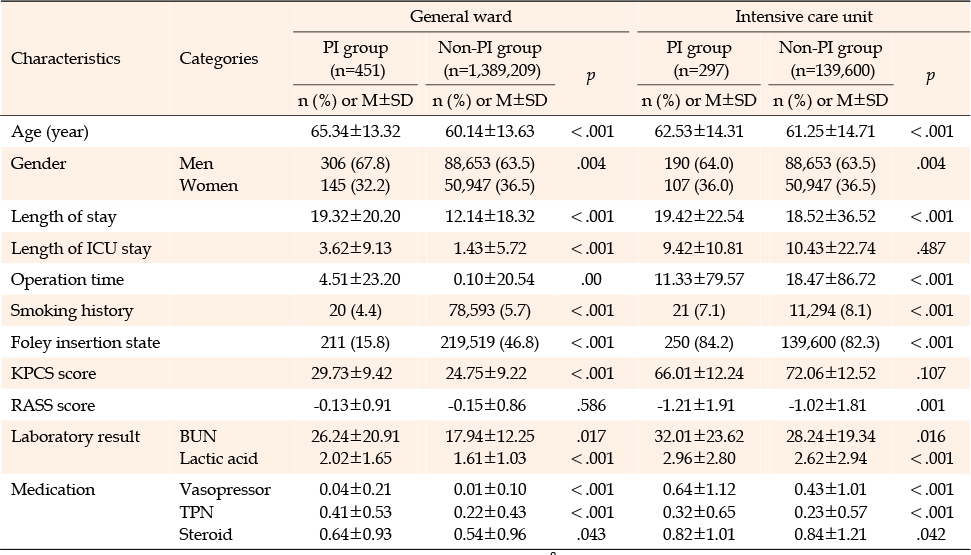
Table 2
Basic Characteristics of the Study Population
In the GW and ICU prediction models developed through the gradient boosting algorithm, several variables were identified as statistically significant in relation to the occurrence of PIs. In the GW model, factors such as the KPCS score, operation time, and the use of devices like Foley catheters were significant. Patients with higher severity scores were at an increased risk of developing PI. The severity of a patient correlated with both direct and indirect nursing care hours, which in turn increased the KPCS score [23], indicating that the KPCS is highly useful for predicting the development of PI. Furthermore, patients who require medical devices experience a higher incidence of PI compared to those who do not [24]. In the ICU model, the length of ICU stay, the use of vasopressor drugs, and the RASS score were identified as key factors. Extended stays in the ICU and the use of vasopressors were primary contributors to the development of PI [25]. Sedation lowers the RASS score, and a low score indicates that the patient is unable to change position independently, thereby increasing the risk of PI [26].
The results of comparing the developed prediction model with the Braden scale are presented in Table 3. For the GW model, the gradient boosting algorithm yielded an AUROC of 0.86, sensitivity of 0.84, specificity of 0.78, accuracy of 0.78, positive predictive value of 0.17, and negative predictive value of 100. For the ICU model, the corresponding values were 0.83, 0.87, 0.54, 0.54, 0.52, and 100, respectively.
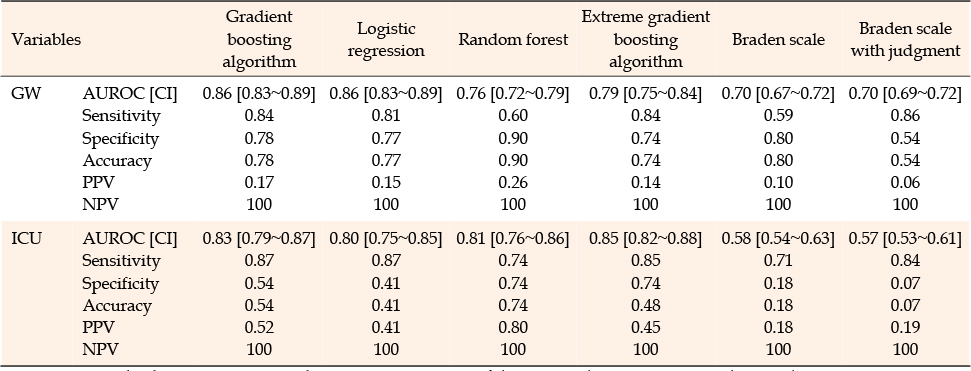
Table 3
Comparison of AUROCs with 95% Confidence Intervals Achieved Using Different Methods with the Testing Cohort
The gradient boosting algorithm demonstrated superior performance across all indicators and achieved the highest AUROC value, as illustrated in Figure 1. Therefore, we selected the gradient boosting algorithm for integration into clinical practice.
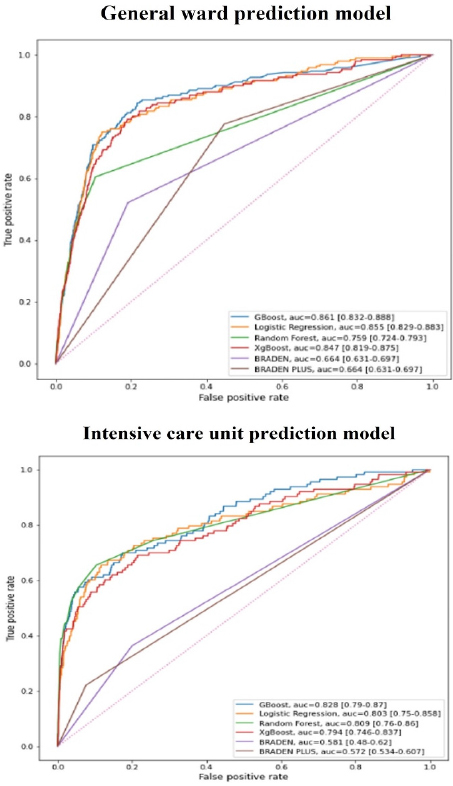
Figure 1
Comparison of areas under the receiver operating characteristic curves for the gradient boosting algorithm and other algorithms.
The patient's predicted PI probability is intuitively displayed on the EHR, as shown in Figure 2. On the EHR screen, the nurse has the ability to update the status to high-risk and provide a textual explanation for this adjustment.
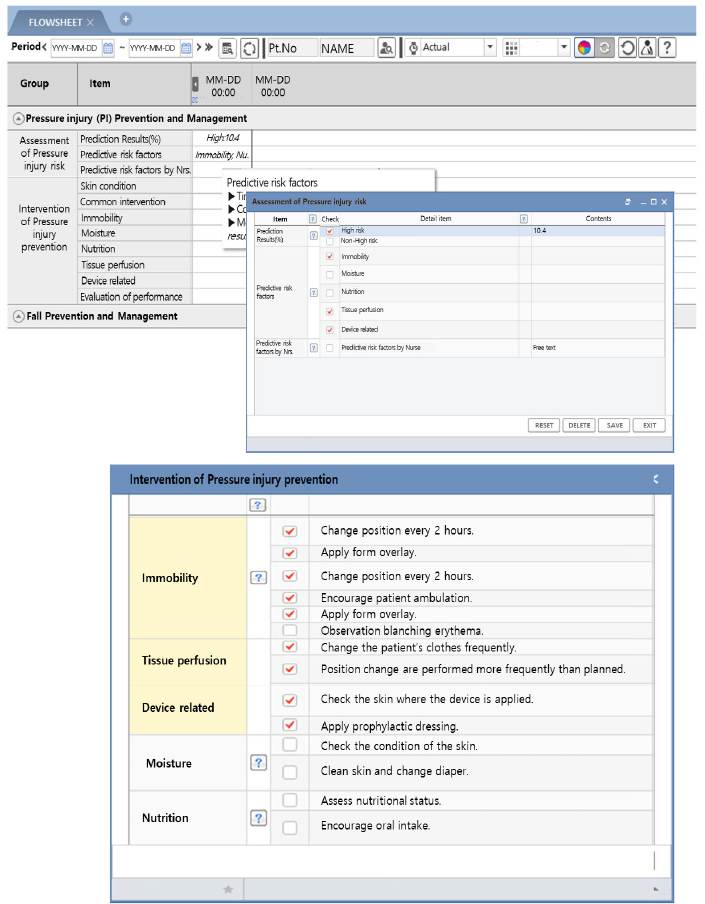
Figure 2
Clinical practice integration of the pressure injury prediction model.
Additionally, nurses can view the patient's representative PI risk factors on the screen. The contribution of each risk factor is determined based on the predictor variable's contribution, and those risk factors that account for the top 80% of the contribution are displayed. These risk factors are prominently shown at the top of the EHR screen and are highlighted by changing colors. Nurses can review these risk factors, implement appropriate PI prevention interventions based on the patient's condition, and document these actions.
In this study, rather than having nurses subjectively evaluate a patient's risk of PI, we developed a PI prediction model that utilizes various risk factors recorded in EHRs to objectively assess a patient's risk of PI. This model was compared with the predictive validity of the Braden scale, a PI risk assessment tool currently in use at the hospitals under study. The model applied the gradient boosting algorithm, which demonstrated the highest predictive validity. This approach is significant because it uses objective indicators rather than tools that may vary with each nurse's assessment, thereby streamlining work and supporting nurses in their clinical decision-making.
We developed and validated a PI prediction model that incorporates a larger number of patients and predictors than previous studies. The variables influencing PI are highly diverse [14]; therefore, our model is likely to predict PI more accurately as it encompasses a broad range of relevant variables. In its development, the model utilized a total of 182 predictor variables, including gender, age, smoking history, weight, Laboratory result, and the use of medical devices such as nasal cannulas and masks.
A PI prediction model was developed using gradient boosting algorithm, logistic regression, and decision trees. Of these, the gradient boosting algorithm demonstrated the highest performance. Given that gradient boosting algorithm is specifically designed for building prediction models with large datasets [21], it was deemed appropriate for our model, which incorporated 182 variables.
Most studies that have developed machine learning algorithm models have not implemented them in real-world nursing clinical practice [16, 17, 19]. In this study, we developed a practical EHR system for nurses and applied it in real-world nursing settings. We presented predicted probabilities and risk factors, along with determinations of whether patients were at high risk or not for developing PIs. Additionally, to accommodate the dynamic nature of patient conditions, we updated the predicted probability value hourly to promptly address any changes in the patient's status.
Nurses can access the risk classification, probability values, and risk factors for PIs for each patient, updated hourly in the Electronic Health Record (EHR). Based on these verified results, nurses can categorize patients into PI risk groups. Additionally, the system identifies specific risk factors for PI in each patient, enabling the implementation of more targeted preventive measures. Therefore, this evidence-based, personalized clinical decision support system facilitates the provision of high-quality nursing care.
This was a retrospective study. Therefore, to confirm the algorithm's performance and enhance its applicability in real-world nursing clinical practice, a prospective study involving both experimental and control groups is necessary.
We developed various models to accommodate the differing conditions and severities of patients in the GW and the ICU. However, patients are not restricted to the GW and may transition between the GW and ICU. Consequently, the variable values input into the prediction model on the day a patient moves to the ICU, after a stay in the GW, are values generated in the GW. Yet, the probability values are recalculated using the ICU model. This transition could introduce bias into the results. Therefore, further research aimed at reducing this bias through post-monitoring is necessary.
This study developed a prediction model for PI that includes both internal medicine and surgical patients without distinguishing between them. However, patient characteristics can vary significantly between wards. Additionally, the causes of PI may differ between internal medicine and surgical patients. Consequently, further research is needed to explore the necessity of creating specific models for each ward, tailored to the unique characteristics of their patients.
Furthermore, the prediction model was developed using data from a single hospital, which limits its generalizability. To confirm its external validity, future studies will need to collect data from multiple hospitals.
We developed and validated a model that predicts the occurrence of PI in patients by utilizing objective clinical data recorded in the EHR. Among the various PI prediction models developed, the gradient boosting algorithm demonstrated the highest predictive validity. This algorithm was subsequently implemented in real-world nursing clinical practice.
This study is significant as it extends beyond development and is implemented in real-world nursing clinical practice. Using this model, nurses are able to monitor the risk classification, probability values, and risk factors for PIs, which are calculated hourly. Therefore, nurses can categorize patients into PI risk groups and apply suitable interventions to prevent pressure injuries based on these risk factors.
Prospective research is necessary to validate the performance of the PI prediction model and enhance its applicability in real-world nursing practice. If this model can be implemented in various medical settings to confirm its validity, it is anticipated that it could accurately and efficiently predict the occurrence of PI for individual patients, serving as a clinical decision support system.
Flow diagram of the study process.Supplementary Figure 1
CONFLICTS OF INTEREST:The authors declared that no conflict of interest exists.
AUTHORSHIP:
Conceptualization or/and Methodology - LJH, YJY, SSY, YKM, HHA, JSY, MKT, PJH, PSH, HJH, SMR, and CWC.
Data curation or/and Analysis - LJH, YJY, SSY, YJM, HHA, JSY, MKT, PJH, PSH, HJH, SMR, and CWC.
Funding acquisition - PSH, HJH and SMR.
Investigation - LJH, YJY, SSY, YJM, HHA, JSY, MKT, PJH, PSH, HJH, SMR, and CWC.
Project administration or/and Supervision - PJH, PSH, HJH, SMR, and CWC.
Resources or/and Software - YJY, JSY and MKT.
Validation - LJH, YJY, SSY, YJM, HHA, JSY, and MKT.
Visualization - LJH, SSY, YJM and HHA.
Writing: original draft or/and review & editing - LJH, YJY, SSY, YJM, HHA, JSY, MKT, PJH, PSH, HJH, SMR, and CWC.
This study was supported by the research fund of the Department of Nursing, Samsung Medical Center in 2019 (No. SMC-NSD-2019-05).
 E-SUBMISSION