

1Department of Nursing, Graduate School, Sahmyook University, Seoul
2Department of Nursing, Sahmyook University, Seoul, Korea
Copyright © 2016 Korean Society of Adult Nursing
This is an Open Access article distributed under the terms of the Creative Commons Attribution Non-Commercial License (http://creativecommons.org/licenses/by-nc/3.0) which permits unrestricted non-commercial use, distribution, and reproduction in any medium, provided the original work is properly cited.

Cognitive Function, Health Promotion Behavior and Quality of Life according to General Characteristics of the Subject (N=152)
| Variables | Categories | n (%) | Perceived cognitive decline | Objective cognitive function | Health promotion behavior | Quality of life | ||||
|---|---|---|---|---|---|---|---|---|---|---|
| M±SD t | t or F (p) Scheffé | M±SD | t or F (p) Scheffé | M±SD | t or F (p) Scheffé | M±SD | t or F (p) Scheffé | |||
| Age (year) | <40a b | 23 (15.1) | 60.96±16.52 | 1.06 | 29.04±1.36 | 15.01 | 94.04±18.23 | 3.07 | 90.04±18.79 | 3.41 |
| 40~49b c | 56 (36.8) | 63.59±24.03 | (.367) | 28.84±1.06 | (<.001) | 98.84±17.38 | (.030) | 87.98±23.05 | (.019) | |
| 50~59c | 59 (38.8) | 68.39±23.77 | 28.37±1.34 | a, b, c>d | 96.68±16.30 | b>d | 79.10±21.76 | |||
| ≥60d | 14 (9.2) | 71.14±30.05 | 26.29±2.23 | 83.79±16.00 | 71.64±29.01 | |||||
| Martial status | Yes | 135 (88.8) | 65.98±24.01 | -0.20 | 28.41±1.55 | 1.06 | 96.27±17.28 | -0.77 | 83.06±23.53 | 0.42 |
| No | 17 (11.2) | 64.76±20.56 | (.842) | 28.82±1.38 | (.292) | 92.82±17.93 | (.441) | 85.59±19.86 | (.672) | |
| Education | ≤MSa | 29 (19.1) | 65.52±24.47 | 0.01 | 27.41±2.13 | 12.46 | 93.21±20.20 | 3.15 | 77.90±25.83 | 1.63 |
| HSb c | 70 (46.1) | 65.71±25.73 | (.991) | 28.43±1.29 | (<.001) | 93.40±17.48 | (.046) | 82.60±23.19 | (.199) | |
| ≥Collegec | 53 (34.9) | 66.19±20.38 | 29.06±1.08 | a<b, c 1 | 100.64±14.54 | 87.30±21.07 | ||||
| Monthly income (10,000 won) | <200a b | 46 (30.3) | 74.11±26.44 | 3.05 | 28.44±1.60 | 0.55 | 90.48±16.43 | 3.35 | 74.13±22.20 | 4.93 |
| 200~399b c | 71 (46.7) | 63.56±23.22 | (.031) | 28.45±1.63 | (.652) | 97.90±17.65 | (.021) | 86.11±22.59 | (.003) | |
| 400~599c d | 20 (13.2) | 60.25±16.21 | 28.20±1.32 | 94.45±14.96 | a<d | 84.35±19.37 | a<b, d | |||
| ≥600d | 15 (9.9) | 58.73±18.86 | 28.87±1.06 | 1 | 104.87±17.40 | 97.13±24.28 | ||||
| Family support | Satisfieda | 97 (63.8) | 62.03±21.10 | 3.66 | 28.53±1.45 | 0.65 | 98.99±17.92 | 4.74 | 87.46±23.29 | 5.14 |
| Moderateb | 47 (30.9) | 72.91±26.94 | (.028) | 28.26±1.78 | (.524) | 91.06±15.07 | (.010) | 77.49±21.39 | (.007) | |
| Unsatisfied | 8 (5.3) | 70.50±23.90 | a<b | 28.75±0.71 | 86.63±13.79 | a>b | 67.75±18.01 | a>b | ||
| Age of menarche | <13a b | 38 (25.0) | 63.39±20.10 | 0.27 | 28.84±1.35 | 3.73 1 | 101.03±16.38 | 2.30 | 89.11±25.70 | 2.16 |
| 14~15b c | 68 (44.7) | 66.68±22.96 | (.764) | 28.56±1.52 | (.026) | 94.51±14.03 | (.104) | 83.29±22.68 | (.119) | |
| >15c | 46 (30.3) | 66.63±27.28 | 27.98±1.60 | a>c | 93.67±21.52 | 78.65±20.77 | ||||
| Menopause | Noa b | 39 (25.7) | 61.44±20.35 | 1.84 | 29.00±1.24 | 10.25 | 98.69±16.65 | 2.03 | 90.41±23.60 | 5.21 |
| Yesb c† | 59 (38.8) | 70.22±27.48 | (.162) | 27.80±1.85 | (<.001) | 92.39±17.59 | (.135) | 76.27±24.96 | (.006) | |
| Yesc† | 54 (35.5) | 64.24±20.61 | 28.78±1.02 | a, c>b | 97.69±17.18 | 85.96±18.44 | a>b | |||
| ECOG PS | 0a b | 25 (16.4) | 51.16±12.97 | 5.20 | 28.48±1.29 | 0.09 1 | 105.20±21.64 | 4.07 | 100.28±19.32 | 9.47 |
| 1b c | 85 (55.9) | 64.88±21.12 | (.001) | 28.42±1.60 | (.986) | 96.41±16.52 | (.004) | 84.98±20.37 | (<.001) | |
| 2c d | 25 (16.4) | 75.44±26.82 | a<c, d | 28.60±1.22 | 92.12±10.49 | a>d | 74.72±23.69 | a>b, c, d | ||
| 3d | 15 (9.9) | 78.13±32.57 | 28.33±2.09 | 84.93±16.90 | 64.13±21.71 | b>d | ||||
| 4 | 2 (1.3) | 79.50±3.54 | 28.50±0.71 | 86.50±3.54 | 54.00±14.14 | |||||
| Comorbidity | Yes | 44 (28.9) | 64.82±27.96 | 0.34 | 28.50±1.65 | 0.58 | 96.58±17.46 | 0.77 | 84.51±22.42 | 0.98 |
| No | 108 (71.1) | 66.26±21.70 | (.734) | 28.34±1.20 | (.563) | 94.18±17.07 | (.440) | 80.48±24.74 | (.331) | |
| Stage | I | 29 (19.1) | 63.79±20.68 | 0.22 | 28.24±1.85 | 0.97 | 96.59±18.76 | 0.49 | 85.07±20.91 | 0.49 |
| II | 77 (50.7) | 65.75±21.85 | (.885) | 28.65±1.14 | (.408) | 96.99±15.79 | (.689) | 84.48±22.84 | (.687) | |
| III | 36 (23.7) | 66.33±26.46 | 28.33±1.97 | 94.39±20.39 | 81.44±24.31 | |||||
| IV | 10 (6.6) | 70.70±34.87 | 28.00±1.33 | 90.80±13.07 | 76.40±28.28 | |||||
| Metastasis | Yes | 46 (36.5) | 70.58±26.92 | -2.35 | 28.50±1.68 | -0.35 | 94.67±19.63 | 0.81 | 82.08±24.89 | 0.64 |
| No | 80 (63.5) | 61.58±19.33 | (.020) | 28.41±1.39 | (.726) | 96.99±14.99 | (.418) | 84.48±21.47 | (.526) | |
| Total chemotherap cycles | ≤6a b | 82 (53.9) | 61.85±20.56 | 3.34 | 28.55±1.39 | 0.53 | 97.88±16.61 | 1.21 | 85.88±22.65 | 1.16 |
| py 7~12b | 51 (33.6) | 72.55±24.96 | (.038) | 28.41±1.71 | (.590) | 93.88±17.92 | (.301) | 79.67±21.19 | (.315) | |
| ≥13 | 19 (12.5) | 65.05±28.92 | a<b | 28.16±1.64 | 92.68±18.56 | 82.26±29.20 | ||||
| Hormone therapy | Yes | 107 (70.9) | 64.28±22.96 | -1.34 | 28.46±1.51 | 0.01 | 96.93±16.66 | 1.52 | 84.06±22.92 | 0.67 |
| No | 44 (29.1) | 69.93±25.08 | (.183) | 28.46±1.62 | (.990) | 92.34±17.58 | (.132) | 81.30±23.85 | (.507) | |
MS=Middle school; HS=High school;
†Related to cancer treatment
Descriptive Statistics of Perceived Cognitive Decline, Objective Cognitive Function, Health Promotion Behavior and Quality of Life (N=152)
| Variable | n (%) | Possible range | Actual range | M±SD | Mean of item±SD |
|---|---|---|---|---|---|
| Objective cognitive function | 0~30 | 22~30 | 28.45±1.53 | ||
| ≤23 score 24~26 score | 2 (1.3) 13 (8.6) | ||||
| 24~26 score | 13 (8.6) | ||||
| ≥27 score | 137 (90.1) | ||||
| Perceived cognitive decline | 0~156 | 35~146 | 65.84±23.56 | 1.69±0.60 | |
| Daily memory | 0~32 | 5~32 | 15.22±6.06 | 1.90±0.76 | |
| Language | 0~36 | 6~36 | 14.38±5.86 | 1.60±0.65 | |
| Executive function: Planning | 0~20 | 1~20 | 7.70±3.36 | 1.54±0.67 | |
| Executive function: Organization | 0~24 | 5~24 | 9.87±4.22 | 1.64±0.70 | |
| Executive function: Divided attention | 0~16 | 3~16 | 7.41±3.53 | 1.85±0.88 | |
| Visuospatial abilities | 0~28 | 4~28 | 11.27±5.01 | 1.61±0.72 | |
| Health promotion behavior | 0~152 | 51~144 | 95.89±17.33 | 2.52±0.46 | |
| Self-actualization | 0~40 | 10~40 | 24.70±6.70 | 2.47±0.67 | |
| Health responsibility | 0~32 | 10~32 | 20.91±4.31 | 2.61±0.54 | |
| Exercise | 0~12 | 3~12 | 6.71±2.12 | 2.24±0.71 | |
| Nutrition | 0~24 | 8~24 | 16.56±3.38 | 2.76±0.56 | |
| Interpersonal support | 0~16 | 5~16 | 10.51±2.50 | 2.63±0.62 | |
| Stress management | 0~28 | 7~28 | 16.49±4.03 | 2.36±0.58 | |
| Quality of life | 0~148 | 21~133 | 83.34±23.10 | 2.25±0.63 | |
| Physical well being | 0~28 | 0~28 | 17.91±7.27 | 2.56±1.04 | |
| Social/family well being | 0~28 | 0~28 | 15.09±6.74 | 2.16±0.96 | |
| Emotional well being | 0~24 | 0~24 | 15.28±5.13 | 2.55±0.85 | |
| Functional well being | 0~28 | 0~28 | 14.24±6.74 | 2.03±0.96 | |
| Additional concerns | 0~40 | 2~37 | 20.82±7.14 | 2.08±0.71 |
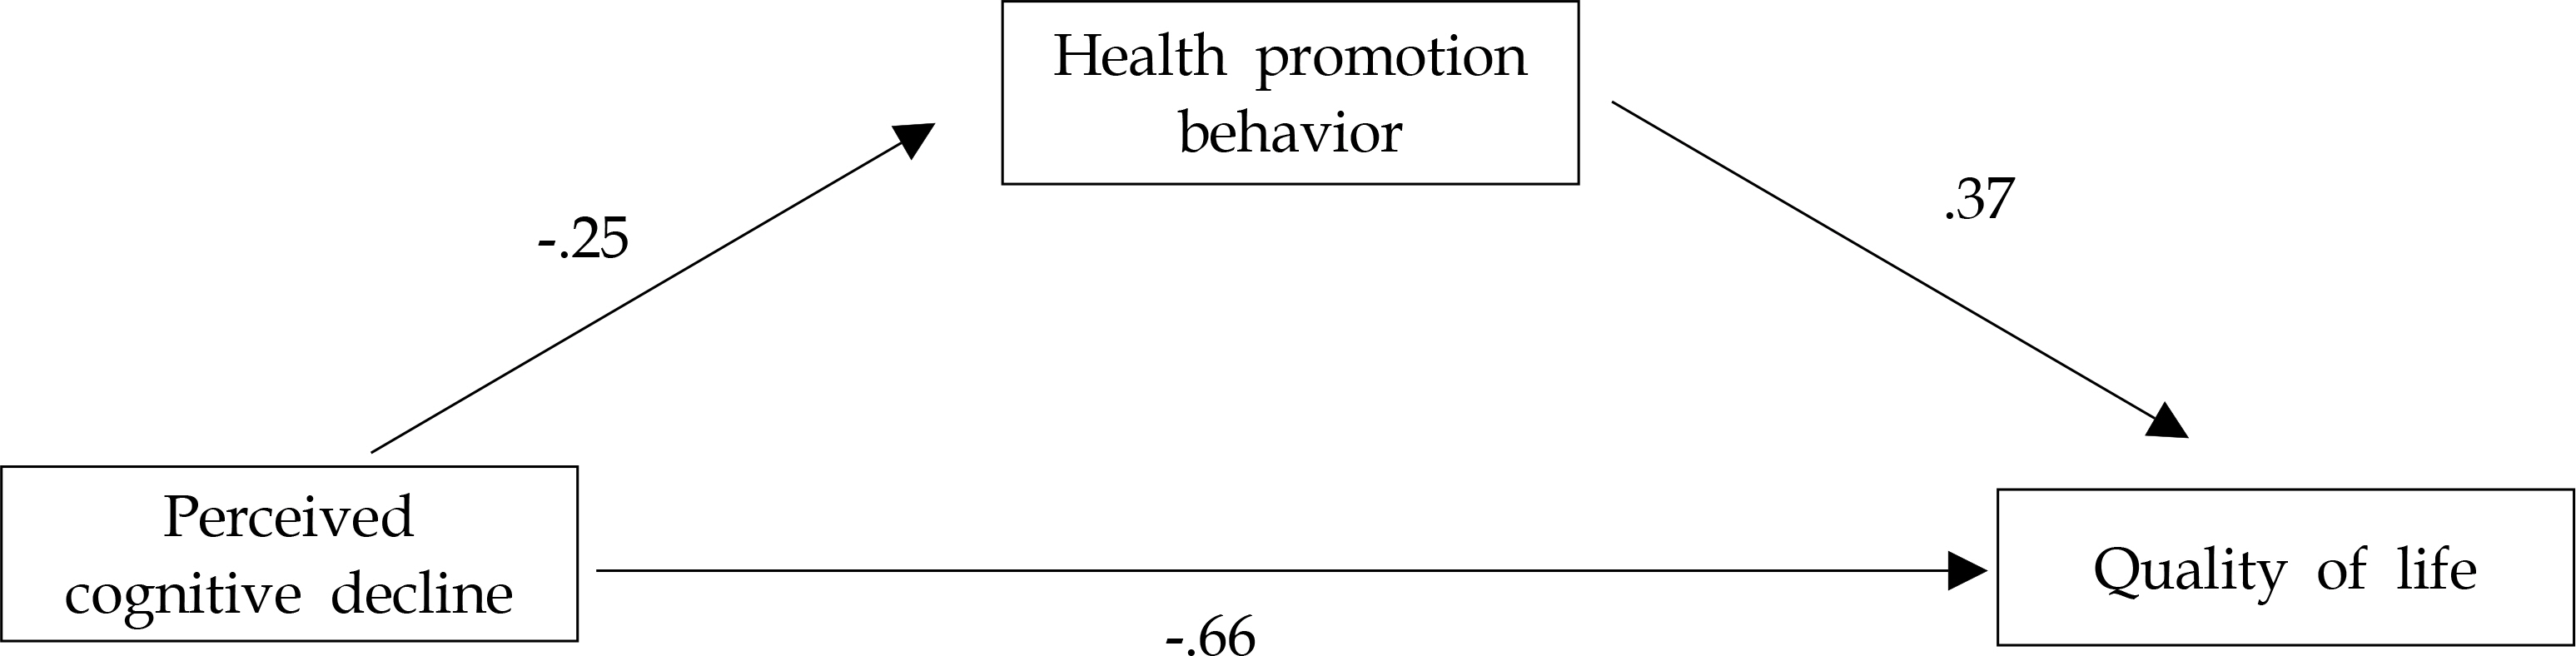
Mediating Effect of Health Promotion Behavior between Perceived Cognitive Decline and Quality of Life (N=152)
| Variables | B | β | t | p | Adj. R2 | F | p |
|---|---|---|---|---|---|---|---|
| Step 1. Perceived cognitive decline → HPB | -.19 | -.25 | -3.22 | .002 | .06 | 10.35 | .002 |
| Step 2. Perceived cognitive decline → QoL | -.65 | -.66 | -10.75 | <.001 | .43 | 115.60 | <.001 |
| Step 3. Perceived cognitive decline, HPB → QoL | .56 | 95.40 | <.001 | ||||
| 1) Perceived cognitive decline → QoL | -.56 | -.57 | -10.10 | <.001 | |||
| 2) HPB → QoL | .49 | .37 | 6.55 | <.001 | |||
| Sobel test: Z=-3.37, p<.001 | |||||||
HPB=health promotion behavior; QoL=quality of life.
MS=Middle school; HS=High school; Related to cancer treatment
HPB=health promotion behavior; QoL=quality of life.
 E-SUBMISSION