Abstract
-
Purpose
This study examined the 16-year longitudinal impact of social frailty on quality of life (QoL) and health-related quality of life (HRQoL) among middle-aged and older adults.
-
Methods
Data were obtained from the Korean Longitudinal Study of Aging (2006–2022), comprising 9,905 participants (6,003, aged 45–64 years; and 3,902, aged ≥65 years). Social frailty was assessed using five components: social support, social activity, social network, loneliness, and living alone. QoL and HRQoL were measured using self-reported satisfaction scales. Generalized estimating equations were applied to adjust for covariates.
-
Results
Social frailty was prevalent among both middle-aged (44.6%) and older adults (60.1%) and was significantly associated with lower QoL and HRQoL. In longitudinal analyses, declines in QoL and HRQoL persisted throughout the follow-up period in older adults, whereas in middle-aged adults, the declines were significant only during the earlier years. In middle-aged adults, current smoking exerted a stronger negative impact on QoL and HRQoL (QoL: β=–4.33, p<.001; HRQoL: β=–2.89, p<.001), while in older adults, lack of regular exercise had a greater effect on HRQoL (β=–3.84, p<.001).
-
Conclusion
Social frailty was associated with lower QoL and HRQoL across both age groups, with stronger and more persistent effects among older adults. Early interventions are needed during midlife, while sustained strategies are essential in later life. Age-specific approaches are crucial to promoting healthy aging.
-
Key Words: Frailty; Longitudinal studies; Quality of life; Social isolation
INTRODUCTION
Frailty is characterized by a state of vulnerability to stressors arising from diminished intrinsic capacity reserves [
1]. Building on this definition, the integrated conceptual frailty model proposed by Gobbens et al. [
2] further elucidates how physical, psychological, and social factors of frailty interact with aging, leading to adverse health outcomes. With the growing importance of early frailty detection and the provision of appropriate services, interest in this issue has increased within community and primary healthcare settings [
3]. Frailty results from a complex interplay of factors such as inadequate nutrition, mobility impairment, unintentional weight loss, cognitive decline, and social isolation [
2]. However, while the physical and psychosocial aspects of frailty have been widely emphasized, relatively less attention has been directed toward its social dimensions [
4].
Social frailty refers to a state of vulnerability that compromises health and well-being, stemming from insufficient social support, connectedness, resources, and fulfillment of basic social needs [
5]. It interacts with both physical and psychological frailty, influencing disease onset, progression, and prevention. Thus, assessing and understanding social frailty is vital [
4]. Social frailty reflects an accumulation of risks or a depletion of essential resources needed to satisfy fundamental social needs throughout life [
5]. A prior review of frailty assessment instruments, emphasizing their social components, identified social activities, social support, social networks, loneliness, and living alone as the most commonly represented constructs within the social domain [
6].
Social frailty can lead to various adverse health outcomes, including cognitive impairment [
7], depression [
8], and increased risks of mortality and functional disability [
9]. Consequently, social frailty negatively affects health-related quality of life (HRQoL) by disrupting both physical and mental health domains—key components of HRQoL [
10,
11]. Moreover, its influence extends beyond health to broader life domains, adversely affecting overall QoL [
12]. While HRQoL primarily reflects health status, quality of life (QoL) encompasses a broader spectrum, including economic conditions, social relationships, job satisfaction, cultural values, and personal goals and expectations [
13]. Therefore, examining both QoL and HRQoL provides a more comprehensive understanding of how social frailty influences well-being and health-related outcomes.
Previous studies on social frailty have largely focused on older adults, limiting understanding of its effects across the life course [
10-
12]. However, evidence indicates that social vulnerability negatively affects both middle-aged and older adults [
9], with differing social characteristics and risk profiles between these groups. Accordingly, it is essential to analyze the effects of social frailty on QoL and HRQoL separately by age group. Furthermore, most prior studies employed cross-sectional designs, offering limited insight into the long-term impacts of social frailty [
10,
11]. To address these gaps, the present study used a longitudinal approach encompassing middle-aged adults (45–64 years) to assess the cumulative effects of social frailty over time. The findings aim to support the development of targeted interventions to mitigate its adverse effects and provide evidence-based guidance for preventive strategies and policies tailored to both middle-aged and older adults, ultimately enhancing QoL and HRQoL.
METHODS
1. Study Design
This longitudinal, descriptive, secondary analysis utilized data from the Korean Longitudinal Study of Aging (KLoSA), which collected data biennially from 2006 to 2022. This study was conducted and reported in accordance with the Strengthening the Reporting of Observational Studies in Epidemiology (STROBE) guidelines.
2. Setting and Samples
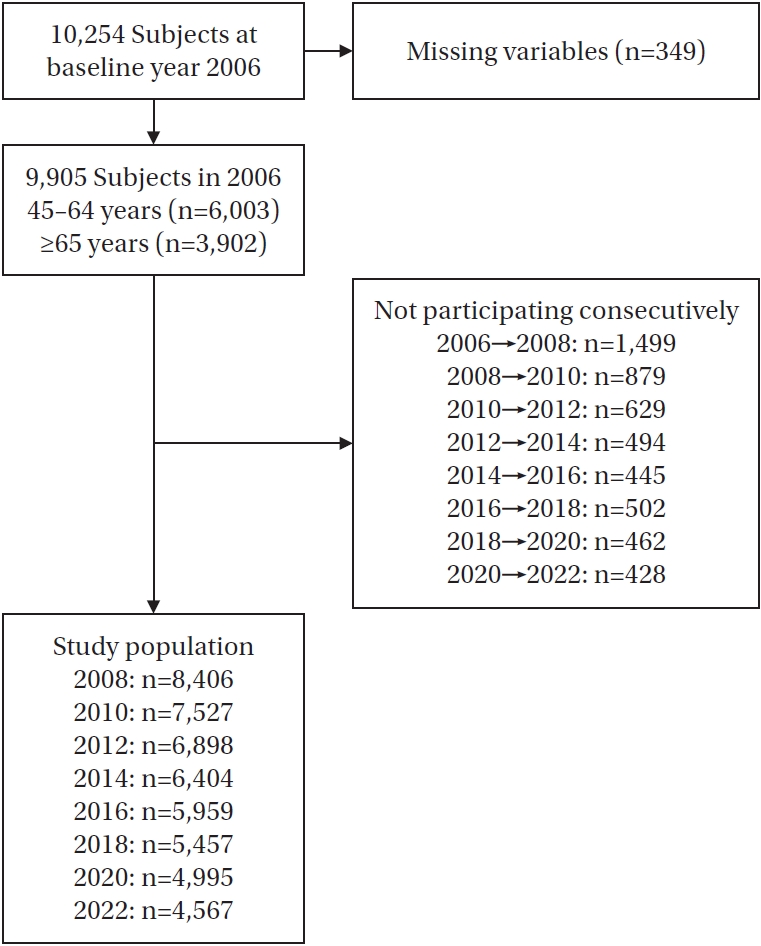
A total of 10,254 individuals participated in the 2006 KLoSA. Participants with missing data on key independent variables (e.g., socioeconomic status, social frailty-related variables, and health-related variables) or dependent variables (QoL and HRQoL) were excluded. Consequently, 9,905 individuals remained in the baseline year (2006), including 6,003 individuals aged 45–64 years and 3,902 individuals aged ≥65 years. However, not all participants completed every subsequent survey wave. After excluding those who did not participate consecutively, the final study population consisted of 8,406 individuals in 2008, 7,527 in 2010, 6,898 in 2012, 6,404 in 2014, 5,959 in 2016, 5,457 in 2018, 4,995 in 2020, and 4,567 in 2022 (
Figure 1).
1) Quality of life and health-related quality of life
QoL was assessed using the question, “How satisfied are you with your overall quality of life compared to your peers of the same age group?” Similarly, HRQoL was measured using the question, “How satisfied are you with your overall health status?” Responses were rated on a 0–100 scale in 10-point increments, with higher scores indicating better QoL and HRQoL. Although baseline QoL and HRQoL data were collected in 2006, they were measured concurrently with independent variables, making it difficult to evaluate the longitudinal impact of social frailty on these outcomes. To establish a clear temporal sequence, only QoL and HRQoL data collected from 2008 onward were included in the analysis.
2) Social frailty
In this study, social frailty was assessed using five key components—social isolation, loneliness, social networks, social support, and social participation—identified in a systematic review by Bessa et al. [
6]. These components were operationalized using corresponding items from the KLoSA, ensuring that the measurement of social frailty was grounded in established literature while appropriately adapted to the KLoSA dataset. Social support was evaluated with the question: “In the future, if you were unable to perform daily activities such as eating, dressing, or using the toilet and required long-term assistance, do you have any relatives or friends—excluding your spouse and those you currently live with—who could help you?” (0=yes, 1=no). Social activity was measured with the question: “Do you participate in any activities (e.g., religious group, social club such as an alumni group or senior center, leisure/cultural/sport group, volunteering, political/civic/interest group)?” (0=yes, 1=no). Social networks were assessed with the question: “Do you have any close friends or relatives?” (0=yes, 1=no). Loneliness was determined by the question: “Did you feel lonely during the past week?” Participants could answer never or seldom (<1 day/week), sometimes (1–2 days/week), often (3–4 days/week), or always (5–7 days/week). Responses of never or seldom (<1 day/week) were coded as 0, and all other responses were coded as 1. Living alone was determined by the question: “Do you live alone?” (0=no, 1=yes). The total social frailty score ranged from 0 to 5. Participants scoring 2 or higher were classified as socially frail, those scoring 1 as socially prefrail, and those scoring 0 as socially nonfrail [
7].
3) Covariates
Sociodemographic and health-related characteristics at baseline were included as covariates, following previous studies [
10,
14,
15]. Sociodemographic variables comprised gender, educational level, region, and job status. Health-related characteristics included depression, chronic diseases, smoking, alcohol consumption, and regular exercise. Regular exercise was assessed using the question, “Do you usually exercise at least once a week?” (0=yes, 1=no). Depression was measured using the 10-item version of the Center for Epidemiologic Studies Depression (CES-D) scale. Participants who endorsed four or more items were classified as having depression [
16].
The KLoSA is a nationally representative panel survey conducted biennially by the Korea Employment Information Service since 2006, targeting individuals aged 45 years or older residing in Korea. The Korea Labor Institute oversaw participant selection, ensuring inclusion of individuals from both urban and rural regions.
Data were collected through face-to-face interviews using a structured questionnaire designed to assess various aspects of the lives of middle-aged and older adults. The survey encompassed a broad range of topics, including demographic characteristics, family structure, health status, medical care, employment history, financial assets, subjective expectations, QoL, and pension-related information [
17].
Data from the KLoSA were collected after obtaining informed consent from all participants by the Korea Employment Information Service. For this study, before initiation, a data use agreement was submitted and approved by the Institutional Review Board of Pukyong National University (Date of approval: 2024/03/12, No. PKNU 2025-02-010).
6. Data Analysis
Analysis of variance was used for continuous variables, and chi-square tests were performed for categorical variables to identify differences in general characteristics according to social frailty. Generalized estimating equations (GEEs) were applied to analyze changes in QoL and HRQoL from 2006 to 2022 based on social frailty status in both age groups. Sociodemographic and health-related characteristics at baseline (2006) were adjusted for in the analysis. The results yielded β coefficients along with their standard errors and p-values. Because QoL and HRQoL, as outcome variables, can fluctuate over time, GEE was selected instead of survival analysis. All QoL and HRQoL measurements obtained during the follow-up period were included in the analysis. The GEE approach was also used to identify factors influencing changes in QoL and HRQoL and to determine the longitudinal association between baseline social frailty (2006) and repeatedly measured QoL and HRQoL across the second to ninth KLoSA waves (2008–2022), after adjusting for covariates. All statistical analyses were performed using IBM SPSS ver. 29.0 (IBM Corp., Armonk, NY, USA), with statistical significance set at p<.05.
RESULTS
1. General Characteristics of Participants by Social Frailty and Age Group at Baseline (2006)
Table 1 presents the general characteristics of the 9,905 participants stratified by social frailty status and age group in 2006. Among them, 6,003 were aged 45–64 years and 3,902 were aged ≥65 years. In the 45–64 age group, 14.0% were nonfrail, 41.4% were prefrail, and 44.6% were frail, whereas in the ≥65 age group, 11.0% were nonfrail, 28.9% were prefrail, and 60.1% were frail. There were no significant gender differences in social frailty among participants aged 45–64 years (
p=.090); however, among those aged ≥65 years, a higher proportion of women were frail compared to men (
p<.001). Educational level, region, and job status showed significant variations in social frailty across both age groups.
Regarding health-related characteristics, the prevalence of depression differed significantly by social frailty status, with a higher proportion observed among frail individuals (p<.001). The number of chronic diseases also varied significantly across frailty groups (p=.022 for ages 45–64; p=.008 for ages ≥65). For health behaviors, current smoking was most prevalent among frail individuals in the 45–64 age group (p=.001), while in the ≥65 age group, the lowest proportion of current smokers was observed among the frail (p<.001). Furthermore, alcohol consumption and engagement in regular physical activity were significantly lower among frail individuals (p<.001 for both).
2. GEE Analysis of Quality of Life and Health-Related Quality of Life by Social Frailty (2006–2022)
The GEE analysis evaluated longitudinal changes in QoL and HRQoL from 2006 to 2022 according to social frailty status (
Table 2,
Figure 2). For QoL, the 45–64 age group showed significant reductions in 2008 (β=–1.50,
p<.001), 2010 (β=–1.13,
p<.001), 2012 (β=–1.91,
p<.001), and 2014 (β=–2.05,
p<.001). In the ≥65 age group, greater declines were observed, particularly in 2010 (β=–2.14,
p<.001), 2012 (β=–3.66,
p<.001), and 2014 (β=–3.25,
p<.001). Among older adults, the decline persisted until 2018 (
p<.001), whereas in the 45–64 age group, no significant changes were found after 2016 (
p=.651). Similarly, HRQoL declined significantly over time. In the 45–64 age group, HRQoL scores were significantly lower in 2008 (β=–1.17,
p<.001), 2010 (β=–0.96,
p=.004), 2012 (β=–1.01,
p=.002), and 2018 (β=–1.20,
p=.001), showing a progressive deterioration. In the ≥65 age group, a more pronounced decline was noted, especially in 2008 (β=–1.063,
p=.011), 2010 (β=–1.94,
p<.001), 2012 (β=–2.08,
p<.001), and 2018 (β=–2.09,
p<.001).
Table 3 presents the GEE results examining the longitudinal relationship between social frailty and changes in QoL and HRQoL among participants aged 45–64 and ≥65 years. After controlling for all covariates, social frailty remained significantly associated with lower QoL and HRQoL in both age groups. Compared with the nonfrail group, the frail group had substantially lower QoL and HRQoL scores, with a greater decline observed among adults aged ≥65 years. In the 45–64 age group, the frail group demonstrated a significant reduction in QoL, which was even more pronounced in the older group. A similar pattern emerged for HRQoL, with the frail group showing the greatest decrease. Among adults aged 45–64 years, women had significantly lower QoL and HRQoL scores than men, whereas in the ≥65 age group, gender differences were not significant for either outcome. Participants with lower educational attainment had significantly lower QoL and HRQoL in both age groups, although the effect on HRQoL was slightly stronger among those aged 45–64 years. In both age groups, urban residents reported significantly lower QoL than rural residents; however, urban residence was not significantly associated with HRQoL decline in either group. Unemployment was significantly linked to lower QoL and HRQoL in both age categories.
Among health-related variables, depression was strongly associated with reduced QoL and HRQoL in both age groups, with a greater impact among adults aged ≥65 years. A higher number of chronic diseases was significantly associated with lower QoL and HRQoL across both age groups, with a stronger influence on HRQoL. Current smoking was also significantly associated with reduced QoL and HRQoL in both groups, with a slightly stronger effect among those aged 45–64 years. Ex-drinking was similarly linked to lower QoL and HRQoL in both age groups. Lack of regular exercise was significantly associated with poorer QoL and HRQoL across both age groups, with a more pronounced effect on HRQoL among older adults compared to the middle-aged group.
DISCUSSION
This study investigated the longitudinal impact of social frailty on QoL and HRQoL over a 16-year follow-up period among middle-aged and older Korean adults. The findings indicate that individuals with social frailty are more vulnerable to declines in both QoL and HRQoL than their socially nonfrail counterparts. This study strengthens existing evidence by demonstrating the long-term effects of social frailty on QoL and HRQoL using a robust longitudinal design. While previous research has primarily focused on older adults (≥65 years), examining either QoL or HRQoL in isolation and relying mostly on cross-sectional data, our study addressed these limitations by including middle-aged adults, analyzing both QoL and HRQoL concurrently, and employing a longitudinal approach. These results underscore the importance of incorporating social factors when understanding the decline in QoL and HRQoL among middle-aged and older adults.
Previous studies have mainly examined social frailty among older adults (≥65 years), emphasizing its influence on health outcomes in later life [
10-
12]. However, our findings reveal that although social frailty is more pronounced among older adults, it is also prevalent in middle-aged adults (45–64 years), suggesting that social vulnerability may begin earlier than previously recognized. These results align with prior research involving adults aged 37–73 years, in which 72.06% of socially frail individuals were between 45 and 64 years of age [
18]. Middle adulthood is a life stage characterized by progressive physical aging, increasing social and economic burdens, and psychological transitions such as the empty-nest syndrome [
19,
20]. The convergence of physical strain, economic pressure, and diminished social roles may collectively contribute to the onset of social frailty in midlife. The early emergence of social frailty may have long-term implications for both QoL and HRQoL, further emphasizing the need for early intervention to mitigate its adverse effects. Additionally, this study found no significant gender differences in social frailty among middle-aged adults, whereas women exhibited a higher prevalence of social frailty among older adults. This disparity may be attributed to structural and socioeconomic factors, including women’s higher life expectancy, increased likelihood of widowhood, and reduced financial security in later life [
21,
22]. In Korea, the Ministry of Health and Welfare’s Customized Care Service for the Elderly offers programs that strengthen social connections among isolated older adults [
23]; however, few of these are specifically tailored for older women. Because social isolation, low social support, and loneliness are distinct yet interrelated factors that negatively affect HRQoL among older women, targeted programs that address these aspects are needed [
24]. From a nursing perspective, social participation interventions tailored to women can help reduce loneliness, enhance social support, and ultimately improve both QoL and HRQoL.
The study findings further demonstrate that declines in QoL and HRQoL were more pronounced among socially frail individuals across both middle-aged (45–64 years) and older (≥65 years) adults. However, the deterioration in QoL was greater than that in HRQoL in both age groups, suggesting that social frailty affects broader life domains beyond physical health, including psychological well-being, independence, and social relationships [
25]. This finding is consistent with prior studies indicating that social isolation, loneliness, and living alone exert broad negative effects—not only on direct health outcomes but also on overall life satisfaction and psychological well-being [
26,
27]. Notably, while declines in QoL and HRQoL persisted until 2018 among older adults (≥65 years), reflecting the cumulative effects of social frailty, they were significant only in the earlier years among middle-aged adults (45–64 years) and did not continue in later years. Previous studies have reported that frailty progresses more rapidly in older adults, with an increasing number transitioning into more severe frailty categories as they age [
28]. This underscores the need for age-specific intervention strategies. For middle-aged adults, preventive approaches may help delay the onset of frailty, while for older adults, sustained support is crucial to mitigate its long-term consequences. These findings align with the present study, suggesting that middle-aged adults benefit more from early interventions focused on social engagement and risk reduction, whereas older adults require continuous, supportive measures to manage cumulative frailty and prevent further decline. In Korea, current programs such as the Ministry of Health and Welfare’s Customized Care Service for the Elderly and community-based health promotion initiatives primarily target older adults who are already vulnerable, with limited preventive strategies for those in midlife. Therefore, preventive measures such as smoking cessation programs, alcohol abstinence education, and initiatives promoting social participation are needed for middle-aged adults. Conversely, sustained interventions, including group exercise and community engagement programs, are vital for older adults. From a nursing perspective, implementing these age-specific strategies can significantly contribute to improving both QoL and HRQoL across the lifespan.
This study highlights the influence of sociodemographic and health-related factors on QoL and HRQoL among middle-aged (45–64 years) and older (≥65 years) adults. First, gender differences were evident among middle-aged adults but not among older adults. Women in midlife had significantly lower QoL and HRQoL than men, likely due to biological transitions such as menopause, shifting self-perceptions with aging, and situational stressors, including caregiving responsibilities, work-related challenges, and financial concerns [
29,
30]. In contrast, gender disparities diminished among older adults, possibly because retirement alleviates the dual burden of work and family responsibilities, provides clearer social roles, and reduces stress from multiple obligations—thereby leading to greater life satisfaction [
31]. Second, lower educational attainment was associated with poorer QoL and HRQoL, with a more pronounced effect among middle-aged adults. This may reflect the double burden faced by middle-aged individuals with lower socioeconomic status: first, they are more likely to experience greater health impairment, and second, once their health deteriorates, they tend to report lower HRQoL compared with higher-status groups [
32]. Finally, health behaviors such as smoking, alcohol consumption, and physical activity significantly influenced both QoL and HRQoL. Current smoking and past alcohol consumption had more pronounced negative effects on QoL and HRQoL among middle-aged adults, whereas physical inactivity had a stronger adverse impact on HRQoL among older adults. These findings are consistent with previous studies indicating that smoking is associated with decreased HRQoL among young and middle-aged populations compared with older adults [
33]. In addition, regular physical activity has been shown to reduce the risk of noncommunicable diseases, including cardiovascular disease, stroke, diabetes, and certain cancers [
34], while also improving mental health outcomes [
35]. Collectively, these results underscore the need for age-specific interventions, such as smoking cessation and alcohol abstinence education for middle-aged adults, and expanded physical activity programs for older adults, to promote well-being in aging populations.
Overall, this study contributes to the literature by providing longitudinal evidence of the impact of social frailty on QoL and HRQoL, highlighting both distinct effects across middle-aged and older adults and common trajectories over time.
Despite its strengths, this study has several limitations that should be considered when interpreting the findings. First, although a longitudinal design was employed, establishing a definitive causal relationship between social frailty and declines in QoL and HRQoL remains challenging. While the results suggest that social frailty precedes a decline in QoL, it is also possible that poor QoL and HRQoL contribute to the progression of social frailty. Future research should incorporate experimental or intervention-based designs to better elucidate these causal mechanisms. Second, this study focused on middle-aged and older Korean adults, which may limit the generalizability of the findings to other cultural or social contexts. The manifestations and effects of social frailty on QoL may vary across societies due to differences in social support systems, cultural norms, and healthcare accessibility. Cross-cultural research is warranted to determine whether these patterns hold in diverse populations. Third, although analyses were adjusted for sociodemographic and health-related variables, potential unmeasured confounders—such as undiagnosed chronic diseases or psychological distress—may still have influenced the results. Future studies should employ mediation and moderation models to better capture the complex interactions between social frailty and QoL. Fourth, QoL and HRQoL were measured using single-item self-reported questions from the KLoSA, which may not fully reflect their multidimensional constructs and could limit measurement reliability and validity. Future research should utilize standardized, multi-item instruments to provide more comprehensive assessments. Despite these limitations, this study offers valuable insights by demonstrating the long-term impact of social frailty on QoL and HRQoL. Addressing these limitations in future research will enhance understanding of the mechanisms underlying social frailty and guide the development of more effective interventions to mitigate its negative consequences.
CONCLUSION
This study extends existing research on social frailty by demonstrating its significant impact on both middle-aged (45–64 years) and older (≥65 years) adults, emphasizing the necessity of interventions across the life course. The findings reveal that social frailty affects not only HRQoL but also overall well-being, with its effects persisting longer among older adults. For middle-aged adults, strategies such as strengthening workplace social support and promoting early lifestyle interventions—particularly smoking cessation and alcohol moderation—may enhance resilience and recovery potential. In contrast, older adults require sustained approaches, including expanded physical activity programs and community engagement initiatives, to prevent the rapid progression of social frailty. Furthermore, community-based social health promotion programs should incorporate age- and gender-specific screening for social frailty, followed by tailored interventions that provide individualized management. By highlighting both the early onset and cumulative effects of social frailty, this study underscores the critical importance of developing targeted policies and evidence-based interventions to improve QoL and promote healthy aging.
-
CONFLICTS OF INTEREST
The authors declared no conflict of interest.
-
AUTHORSHIP
Study conception and design acquisition, drafting or critical revision of the manuscript for important intellectual content - YK and YL; analysis, interpretation of the data - YL.
-
FUNDING
None.
-
ACKNOWLEDGEMENT
None.
-
DATA AVAILABILITY STATEMENT
This study used publicly available data from the Korea Employment Information Service. The dataset can be accessed at: https://survey.keis.or.kr/eng/klosa/klosa01.jsp.
Figure 1.

Figure 2.Longitudinal changes in quality of life and health-related quality of life over the period 2006–2022. GEE=generalized estimating equation.
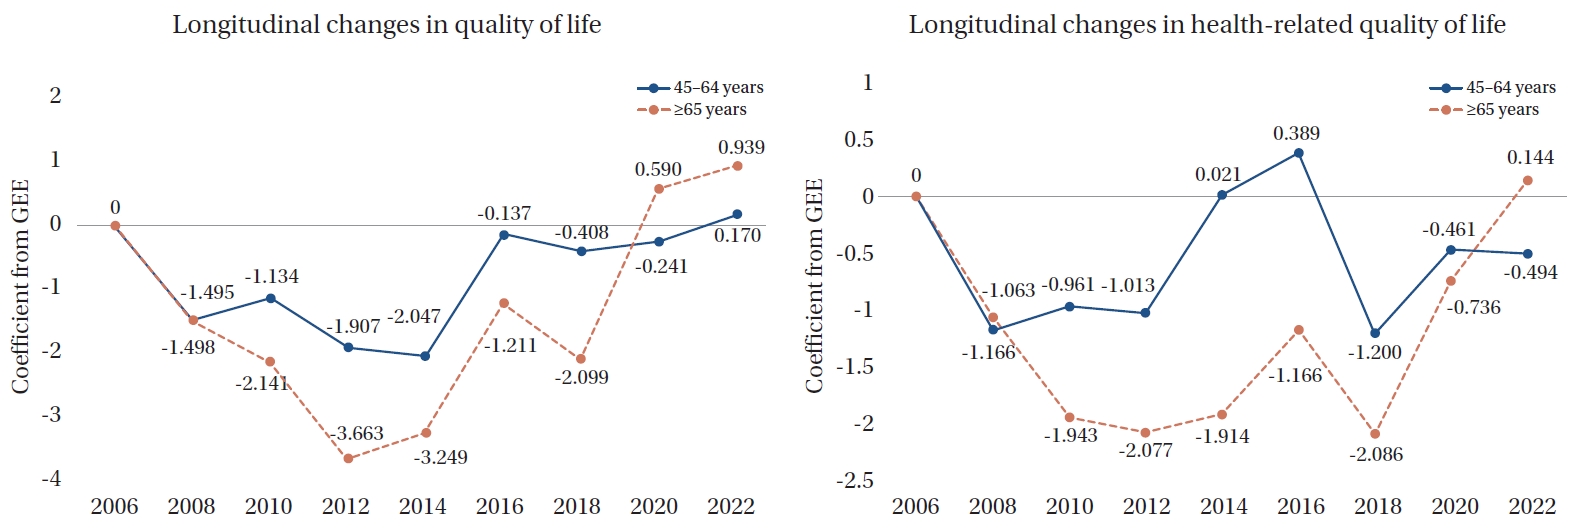
Table 1.General Characteristics of Participants by Social Frailty and Age Group at Baseline (2006) (N=9,905)
|
Characteristics |
Age 45–64 years (n=6,003) |
Age ≥65 years (n=3,902) |
|
Socially nonfrail |
Socially prefrail |
Socially frail |
p
|
Socially nonfrail |
Socially prefrail |
Socially frail |
p
|
|
No. of participants (%) |
842 (14.0) |
2,484 (41.4) |
2,677 (44.6) |
|
431 (11.0) |
1,127 (28.9) |
2,344 (60.1) |
|
|
Gender |
|
|
|
.090 |
|
|
|
<.001 |
|
Men |
352 (41.8) |
1,145 (46.1) |
1,192 (44.5) |
|
239 (55.5) |
528 (46.9) |
911 (38.9) |
|
|
Women |
490 (58.2) |
1,339 (53.9) |
1,485 (55.5) |
|
192 (44.5) |
599 (53.1) |
1,433 (61.1) |
|
|
Educational level |
|
|
|
<.001 |
|
|
|
<.001 |
|
Middle school or above |
622 (73.9) |
1,891(76.1) |
1,740 (65.0) |
|
186 (43.2) |
394 (35.0) |
543 (23.2) |
|
|
Elementary school or below |
220 (26.1) |
593 (23.9) |
937 (35.0) |
|
24 (56.8) |
733 (65.0) |
1,801 (76.8) |
|
|
Region |
|
|
|
<.001 |
|
|
|
.034 |
|
Urban |
635 (75.4) |
2,081 (83.8) |
2,191 (81.8) |
|
289 (67.1) |
827 (73.4) |
1,650 (70.4) |
|
|
Rural |
207 (24.6) |
403 (16.2) |
486 (18.2) |
|
142 (32.9) |
300 (26.6) |
694 (29.6) |
|
|
Job status |
|
|
|
<.001 |
|
|
|
<.001 |
|
No |
363 (43.1) |
1,091 (43.9) |
1,358 (50.7) |
|
322 (74.7) |
905 (80.3) |
2,008 (85.7) |
|
|
Yes |
479 (56.9) |
1,393 (56.1) |
1,319 (49.3) |
|
108 (25.3) |
222 (19.7) |
336 (14.3) |
|
|
Depression |
|
|
|
<.001 |
|
|
|
<.001 |
|
No |
479 (56.9) |
1,269 (51.1) |
1,166 (43.6) |
|
228 (52.9) |
470 (41.7) |
749 (32.0) |
|
|
Yes |
363 (43.1) |
1,215 (48.9) |
1,511 (56.4) |
|
203 (47.1) |
657 (58.3) |
1,595 (68.0) |
|
|
No. of chronic diseases |
0.44±0.70 |
0.44±0.74 |
0.61±0.91 |
<.001 |
1.02±0.98 |
1.04±1.03 |
1.13±1.05 |
.022 |
|
Smoking |
|
|
|
.001 |
|
|
|
<.001 |
|
Nonsmoking |
610 (72.4) |
1,760 (70.9) |
1,820 (68.0) |
|
289 (67.1) |
796 (70.6) |
1,760 (75.1) |
|
|
Ex-smoking |
80 (9.5) |
203 (8.2) |
208 (7.8) |
|
77 (17.9) |
140 (12.4) |
244 (10.4) |
|
|
Current smoking |
152 (18.1) |
521 (21.0) |
649 (24.2) |
|
65 (15.1) |
191 (16.9) |
340 (14.5) |
|
|
Drinking alcohol |
|
|
|
.010 |
|
|
|
<.001 |
|
Nondrinking |
397 (47.1) |
1,258 (50.6) |
1,377 (51.4) |
|
229 (53.1) |
669 (59.4) |
1,531 (65.3) |
|
|
Ex-drinking |
37 (4.4) |
99 (4.0) |
147 (5.5) |
|
39 (9.0) |
97 (8.6) |
235 (10.0) |
|
|
Current drinking |
408 (48.5) |
1,127 (45.4) |
1,153 (43.1) |
|
163 (37.8) |
361 (32.0) |
578 (24.7) |
|
|
Regular exercise |
|
|
|
<.001 |
|
|
|
<.001 |
|
No |
431 (51.2) |
1,280 (51.5) |
1,696 (63.4) |
|
237 (55.0) |
683 (60.6) |
1,725 (73.6) |
|
|
Yes |
411 (48.8) |
1,204 (48.5) |
981 (36.6) |
|
194 (45.0) |
444 (39.4) |
619 (26.4) |
|
Table 2.Longitudinal Generalized Estimating Equations Analysis of Quality of Life and Health-Related Quality of Life by Social Frailty (2006–2022) (N=9,905)
|
Year |
Adjusted†
|
|
Age 45–64 years |
Age ≥65 years |
|
β |
SE |
p
|
β |
SE |
p
|
|
Longitudinal changes in quality of life |
|
|
|
|
|
|
|
Socially frail group (Ref. nonfrail group) |
–4.01 |
0.38 |
<.001 |
–7.22 |
0.61 |
<.001 |
|
2008 (2006) |
–1.50 |
0.28 |
<.001 |
–1.50 |
0.37 |
<.001 |
|
2010 (2006) |
–1.13 |
0.29 |
<.001 |
–2.14 |
0.39 |
<.001 |
|
2012 (2006) |
–1.91 |
0.29 |
<.001 |
–3.66 |
0.41 |
<.001 |
|
2014 (2006) |
–2.05 |
0.30 |
<.001 |
–3.25 |
0.44 |
<.001 |
|
2016 (2006) |
–0.14 |
0.30 |
.651 |
–1.21 |
0.46 |
.008 |
|
2018 (2006) |
–0.41 |
0.32 |
.200 |
–2.10 |
0.51 |
<.001 |
|
2020 (2006) |
–0.24 |
0.33 |
.460 |
0.59 |
0.55 |
.280 |
|
2022 (2006) |
0.17 |
0.33 |
.603 |
0.94 |
0.56 |
.095 |
|
Longitudinal changes in health-related quality of life |
|
|
|
|
|
|
|
Socially frail group (Ref. nonfrail group) |
–2.97 |
0.43 |
<.001 |
–5.84 |
0.71 |
<.001 |
|
2008 (2006) |
–1.17 |
0.31 |
<.001 |
–1.06 |
0.42 |
.011 |
|
2010 (2006) |
–0.96 |
0.33 |
.004 |
–1.94 |
0.46 |
<.001 |
|
2012 (2006) |
–1.01 |
0.33 |
.002 |
–2.08 |
0.47 |
<.001 |
|
2014 (2006) |
0.02 |
0.34 |
.952 |
–1.91 |
0.52 |
<.001 |
|
2016 (2006) |
0.39 |
0.35 |
.267 |
–1.17 |
0.55 |
.034 |
|
2018 (2006) |
–1.20 |
0.37 |
.001 |
–2.09 |
0.59 |
<.001 |
|
2020 (2006) |
–0.46 |
0.38 |
.222 |
–0.74 |
0.64 |
.251 |
|
2022 (2006) |
–0.49 |
0.38 |
.192 |
0.14 |
0.70 |
.836 |
Table 3.Factors Influencing Longitudinal Changes in Quality of Life and Health-Related Quality of Life by Age Group: A Generalized Estimating Equations Analysis (N=9,905)
|
Variables |
Quality of life |
Health-related quality of life |
|
Age 45–64 years |
Age ≥65 years |
Age 45–64 years |
Age ≥65 years |
|
β |
SE |
p
|
β |
SE |
p
|
β |
SE |
p
|
β |
SE |
p
|
|
Social frailty |
|
|
|
|
|
|
|
|
|
|
|
|
|
Nonfrail |
Ref |
|
|
Ref |
|
|
Ref |
|
|
Ref |
|
|
|
Prefrail |
–1.50 |
0.42 |
<.001 |
–3.53 |
0.70 |
<.001 |
–0.74 |
0.48 |
.122 |
–2.11 |
0.87 |
.015 |
|
Frail |
–5.85 |
0.44 |
<.001 |
–8.42 |
0.69 |
<.001 |
–4.97 |
0.49 |
<.001 |
–8.10 |
0.83 |
<.001 |
|
Gender |
|
|
|
|
|
|
|
|
|
|
|
|
|
Men |
Ref |
|
|
Ref |
|
|
Ref |
|
|
Ref |
|
|
|
Women |
–1.72 |
0.47 |
<.001 |
–0.69 |
0.67 |
.305 |
–1.25 |
0.53 |
.018 |
–1.46 |
0.77 |
.059 |
|
Educational level |
|
|
|
|
|
|
|
|
|
|
|
|
|
Middle school or above |
Ref |
|
|
Ref |
|
|
Ref |
|
|
Ref |
|
|
|
Elementary school or below |
–4.71 |
0.37 |
<.001 |
–3.48 |
0.59 |
<.001 |
–5.86 |
0.42 |
<.001 |
–4.36 |
0.66 |
<.001 |
|
Region |
|
|
|
|
|
|
|
|
|
|
|
|
|
Urban |
–1.90 |
0.37 |
<.001 |
–2.70 |
0.52 |
<.001 |
–0.13 |
0.42 |
.750 |
–0.46 |
0.59 |
.443 |
|
Rural |
Ref |
|
|
Ref |
|
|
Ref |
|
|
Ref |
|
|
|
Job status |
|
|
|
|
|
|
|
|
|
|
|
|
|
No |
–2.34 |
0.35 |
<.001 |
–2.10 |
0.61 |
.001 |
–3.79 |
0.39 |
<.001 |
–3.78 |
0.69 |
<.001 |
|
Yes |
Ref |
|
|
Ref |
|
|
Ref |
|
|
Ref |
|
|
|
Depression |
|
|
|
|
|
|
|
|
|
|
|
|
|
No |
Ref |
|
|
Ref |
|
|
Ref |
|
|
Ref |
|
|
|
Yes |
–1.32 |
0.30 |
<.001 |
–3.41 |
0.48 |
<.001 |
–1.17 |
0.34 |
.001 |
–2.95 |
0.54 |
<.001 |
|
No. of chronic diseases |
–1.89 |
0.21 |
<.001 |
–1.47 |
0.23 |
<.001 |
–4.45 |
0.23 |
<.001 |
–3.23 |
0.26 |
<.001 |
|
Smoking |
|
|
|
|
|
|
|
|
|
|
|
|
|
Nonsmoking |
Ref |
|
|
Ref |
|
|
Ref |
|
|
Ref |
|
|
|
Ex-smoking |
–0.64 |
0.62 |
.305 |
–1.38 |
0.84 |
.098 |
–0.51 |
0.70 |
.464 |
–1.47 |
0.93 |
.116 |
|
Current smoking |
–4.33 |
0.51 |
<.001 |
–2.68 |
0.77 |
<.001 |
–2.89 |
0.56 |
<.001 |
–2.18 |
0.86 |
.012 |
|
Drinking alcohol |
|
|
|
|
|
|
|
|
|
|
|
|
|
Nondrinking |
Ref |
|
|
Ref |
|
|
Ref |
|
|
Ref |
|
|
|
Ex-drinking |
–3.53 |
0.89 |
<.001 |
–2.80 |
0.98 |
.004 |
–3.93 |
1.01 |
<.001 |
–3.69 |
1.08 |
.001 |
|
Current drinking |
–0.07 |
0.37 |
.843 |
–0.44 |
0.62 |
.47 |
0.961 |
0.42 |
.021 |
–0.21 |
0.70 |
.765 |
|
Regular exercise |
|
|
|
|
|
|
|
|
|
|
|
|
|
No |
–3.09 |
0.32 |
<.001 |
–2.86 |
0.54 |
<.001 |
–2.96 |
0.35 |
<.001 |
–3.84 |
0.60 |
<.001 |
|
Yes |
Ref |
|
|
Ref |
|
|
Ref |
|
|
Ref |
|
|
REFERENCES
- 1. World Health Organization (WHO). WHO clinical consortium on healthy ageing: topic focus: frailty and intrinsic capacity. Geneva: WHO; 2016. p. 22.
- 2. Gobbens RJ, Luijkx KG, Wijnen-Sponselee MT, Schols JM. Towards an integral conceptual model of frailty. J Nutr Health Aging. 2010;14(3):175-81. https://doi.org/10.1007/s12603-010-0045-6
- 3. Cho B, Shim H. Diagnosis and management of frailty. J Korean Med Assoc. 2024;67(7):442-8. https://doi.org/10.5124/jkma.2024.67.7.442
- 4. Kim D, Arai H. Social frailty. Korean J Geriatr Gerontol. 2015;16(2):44-9. https://doi.org/10.15656/kjcg.2015.16.2.44
- 5. Bunt S, Steverink N, Olthof J, van der Schans CP, Hobbelen JS. Social frailty in older adults: a scoping review. Eur J Ageing. 2017;14(3):323-34. https://doi.org/10.1007/s10433-017-0414-7
- 6. Bessa B, Ribeiro O, Coelho T. Assessing the social dimension of frailty in old age: a systematic review. Arch Gerontol Geriatr. 2018;78:101-13. https://doi.org/10.1016/j.archger.2018.06.005
- 7. Lee JJ, Park MK, Kim N, Kim L, Kim GS. Longitudinal relationship between baseline social frailty and cognitive impairment in older adults: 14-year follow-up results from the Korean longitudinal study of ageing. J Am Med Dir Assoc. 2024;25(9):105124. https://doi.org/10.1016/j.jamda.2024.105124
- 8. Qi X, Li J. The relationship between social frailty and depressive symptoms in the elderly: a scoping review. Int J Environ Res Public Health. 2022;19(24):16683. https://doi.org/10.3390/ijerph192416683
- 9. Liu HY, Peng LN, Lee WJ, Chou MY, Liang CK, Hsiao FY, et al. Differential moderation effects of ApoE and 5-HTTLPR genotypes on social vulnerability in predicting mortality among community-dwelling middle-aged and older adults: a nationwide population-based study. Aging (Albany NY). 2021;13(19):23348-60. https://doi.org/10.18632/aging.203629
- 10. Ko Y, Lee K. Social frailty and health-related quality of life in community-dwelling older adults. Int J Environ Res Public Health. 2022;19(9):5659. https://doi.org/10.3390/ijerph19095659
- 11. Zhang X, Tan SS, Franse CB, Alhambra-Borra T, Dura-Ferrandis E, Bilajac L, et al. Association between physical, psychological and social frailty and health-related quality of life among older people. Eur J Public Health. 2019;29(5):936-42. https://doi.org/10.1093/eurpub/ckz099
- 12. Gobbens RJ, van Assen MA. The prediction of quality of life by physical, psychological and social components of frailty in community-dwelling older people. Qual Life Res. 2014;23(8):2289-300. https://doi.org/10.1007/s11136-014-0672-1
- 13. Karimi M, Brazier J. Health, health-related quality of life, and quality of life: what is the difference? Pharmacoeconomics. 2016;34(7):645-9. https://doi.org/10.1007/s40273-016-0389-9
- 14. Chung SS, Joung KH. Factors related to quality of life among middle-aged and older korean adults in 2006 and 2014: a nationally representative study. Arch Psychiatr Nurs. 2018;32(6):861-7. https://doi.org/10.1016/j.apnu.2018.06.012
- 15. Nari F, Jeong W, Jang BN, Lee HJ, Park EC. Association between healthy lifestyle score changes and quality of life and health-related quality of life: a longitudinal analysis of South Korean panel data. BMJ Open. 2021;11(10):e047933. https://doi.org/10.1136/bmjopen-2020-047933
- 16. Kim YM, Jang SN, Cho SI. Working hours, social engagement, and depressive symptoms: an extended work-life balance for older adults. BMC Public Health. 2023;23(1):2442. https://doi.org/10.1186/s12889-023-17072-x
- 17. Kim KH, Park JA, Hong SH, Kim MH. A Korean Longitudinal Study of the Ageing (KLoSA) basic analysis report. Sejong: Korea Employment Information Service; 2023.
- 18. Hao M, Jiang S, Li X, Wang S, Li Y, Hu Z, et al. Association of social frailty with risk of all-cause and cause-specific mortality in middle-aged and older adults: a prospective cohort study. SSRN 4709954 [Preprint]. Posted 2024 February 1. https://doi.org/10.2139/ssrn.4709954
- 19. Park MA, Yoon YS. A qualitative study on the self-transcendence experience of middle-aged working women participating in self-transcendence and health program. Korean J Rehabil Nurs. 2024;27(2):88-99. https://doi.org/10.7587/kjrehn.2024.88
- 20. Burn K, Dennerstein L, Browning C, Szoeke C. Patterns of social engagement in the transition to later life. Maturitas. 2016;88:90-5. https://doi.org/10.1016/j.maturitas.2016.03.016
- 21. Bulanda JR, Brown JS, Yamashita T. Marital quality, marital dissolution, and mortality risk during the later life course. Soc Sci Med. 2016;165:119-27. https://doi.org/10.1016/j.socscimed.2016.07.025
- 22. Luy M, Gast K. Do women live longer or do men die earlier? Reflections on the causes of sex differences in life expectancy. Gerontology. 2013;60(2):143-53. https://doi.org/10.1159/000355310
- 23. Ministry of Health and Welfare. Customized care service for the elderly [Internet]. Sejong: Ministry of Health and Welfare; 2025 [cited 2025 September 15]. Available from: https://www.mohw.go.kr/menu.es?mid=a10712010400
- 24. Freak-Poli R, Ryan J, Tran T, Owen A, McHugh Power J, Berk M, et al. Social isolation, social support and loneliness as independent concepts, and their relationship with health-related quality of life among older women. Aging Ment Health. 2022;26(7):1335-44. https://doi.org/10.1080/13607863.2021.1940097
- 25. The WHOQOL Group. What quality of life? World Health Organization quality of life assessment. World Health Forum. 1996;17(4):354-6.
- 26. Tseng HY, Lee CY, Wu CS, Wu IC, Chang HY, Hsu CC, et al. Living alone and loneliness in predicting health-related quality of life: results from the Healthy Aging Longitudinal Study in Taiwan (HALST). Research Square [Preprint]. Posted 2023 February 27. https://doi.org/10.21203/rs.3.rs-2618842/v1
- 27. Vespa A, Spatuzzi R, Fabbietti P, Di Rosa M, Bonfigli AR, Corsonello A, et al. Association between sense of loneliness and quality of life in older adults with multimorbidity. Int J Environ Res Public Health. 2023;20(3):2615. https://doi.org/10.3390/ijerph20032615
- 28. Walsh B, Fogg C, Harris S, Roderick P, de Lusignan S, England T, et al. Frailty transitions and prevalence in an ageing population: longitudinal analysis of primary care data from an open cohort of adults aged 50 and over in England, 2006-2017. Age Ageing. 2023;52(5):afad058. https://doi.org/10.1093/ageing/afad058
- 29. El Khoudary SR, Greendale G, Crawford SL, Avis NE, Brooks MM, Thurston RC, et al. The menopause transition and women's health at midlife: a progress report from the Study of Women's Health Across the Nation (SWAN). Menopause. 2019;26(10):1213-27. https://doi.org/10.1097/gme.0000000000001424
- 30. Park MJ, Wee H. Effects of middle-aged women's demographics, health behavior, and health status on health-related quality of life by economic activity participation: panel evidence from Korea. Iran J Public Health. 2024;53(4):809-17. https://doi.org/10.18502/ijph.v53i4.15557
- 31. Cho K, Jun HJ, Lee EJ. Types of retirement satisfaction and life satisfaction among middle and older adults: focusing on gender differences. J Korea Acad Ind Coop Soc. 2019;20(4):371-81. http://doi.org/10.5762/KAIS.2019.20.4.371
- 32. Mielck A, Reitmeir P, Vogelmann M, Leidl R. Impact of educational level on health-related quality of life (HRQL): results from Germany based on the EuroQol 5D (EQ-5D). Eur J Public Health. 2013;23(1):45-9. https://doi.org/10.1093/eurpub/ckr206
- 33. Zhong G, Shu Y, Li H, Zhou Y, Wei Q, Yang B, et al. Association between smoking status and health-related quality of life: a study on differences among age groups. Front Public Health. 2024;12:1508236. https://doi.org/10.3389/fpubh.2024.1508236
- 34. World Health Organization (WHO). Global action plan on physical activity 2018–2030: more active people for a healthier world. Geneva: WHO; 2018. p. 56.
- 35. Schuch FB, Vancampfort D, Richards J, Rosenbaum S, Ward PB, Stubbs B. Exercise as a treatment for depression: a meta-analysis adjusting for publication bias. J Psychiatr Res. 2016;77:42-51. https://doi.org/10.1016/j.jpsychires.2016.02.023


 E-SUBMISSION
