Abstract
-
Purpose
Self-rated health in individuals with chronic diseases is influenced by various factors, including dietary adherence and physical activity. However, limited research has investigated how these factors relate to self-rated health among people with chronic kidney disease. Therefore, this study aimed to describe self-rated health and identify its associated factors in this population.
-
Methods
This cross-sectional, secondary data analysis utilized datasets from the seventh Korea National Health and Nutrition Examination Survey, which were collected between 2016 and 2018. A total of 557 participants (mean age=74.8 years) with a glomerular filtration rate of <60 mL/min/1.73 m² were included. Data from health interviews and examinations were analyzed to assess self-rated health, dietary adherence, and physical activity. Descriptive and inferential statistical methods were employed for analysis.
-
Results
Among the 557 participants, 42.6% rated their health as poor. Factors such as sex, age, income, smoking history, anxiety/depression, number of comorbidities, glomerular filtration rate, and physical activity were significantly associated with self-rated health. In contrast, dietary adherence did not exhibit a significant association.
-
Conclusion
Understanding the factors associated with self-rated health can inform the development of nursing interventions aimed at improving self-rated health among patients with chronic kidney disease.
-
Key Words: Kidney diseases, chronic; Health surveys; Nursing; Self-rated health
INTRODUCTION
Globally, approximately 850 million individuals are affected by kidney disease, a figure that is double the prevalence of diabetes, which impacts 420 million people [
1]. The global prevalence of chronic kidney disease (CKD) exceeds 10%, with reported rates of 10.4% in men and 11.8% in women [
1,
2]. In South Korea, the prevalence of CKD among adults aged 19 years and older was reported to be 8.4% in 2021 [
3]. Over the past decade, medical expenditures for CKD treatment in South Korea have doubled [
2,
3]. Beyond its clinical and economic burden, CKD significantly affects individuals’ perceptions of health and overall well-being [
4-
7].
Self-rated health (SRH) is a simple yet efficient measure that captures individuals’ perceptions of their health, integrating biological, psychological, and social aspects, including personal cultural beliefs [
6]. Among people with CKD, SRH is an important indicator of renal disease complications and hospital admissions, and it has also been significantly associated with mortality [
4,
6]. Previous studies have found that 47% to 53% of adults with Stage 3 to 5 CKD perceive their health as poor to fair [
5], which is higher than the proportions reported among those with hypertension (37%) and diabetes (39.7%) [
8,
9]. Individuals with CKD experience significant health burdens—including symptoms, functional limitations, and disease-related distress—all of which may negatively influence their SRH [
5-
7]. Given that SRH is a strong predictor of adverse clinical outcomes in CKD, assessing SRH and identifying its associated factors are essential [
5,
10,
11]. According to previous research, SRH in individuals with CKD is associated with several key factors, including sociodemographic characteristics (e.g., age, household income) [
7,
10]; clinical indicators (such as body mass index [BMI], comorbid conditions, chronic illnesses) [
7,
10,
12]; health behaviors (e.g., smoking, physical activity [PA], sleep quality) [
7]; inflammatory markers (e.g., C-reactive protein, white blood cell count); and psychosocial variables (e.g., stress, activity limitation). This multifactorial nature of SRH aligns with the Wilson and Cleary model of health-related quality of life, which conceptualizes SRH as an outcome influenced by biological, functional, behavioral, and psychosocial domains [
13]. Although the multifactorial nature of SRH has been explored in previous studies of CKD, research on this topic remains limited. Further investigation is needed to more accurately identify the diverse factors associated with SRH.
Dietary adherence, defined as following healthcare providers’ dietary recommendations, is essential for managing CKD and may influence SRH by improving clinical outcomes and overall well-being [
6,
14]. As dietary adherence helps control metabolic disturbances and reduces symptom burden, it may contribute to better self-perceived health in individuals with CKD [
5,
6,
14]. Given that adherence to health behaviors is linked to improved health perceptions [
5,
15], dietary adherence could represent a modifiable factor for enhancing SRH in CKD. However, findings from studies on other chronic diseases remain inconsistent [
5,
14], and the association between dietary adherence and SRH in CKD is not well established, highlighting the need for further research.
PA is well documented to promote health by alleviating disease-related symptoms, improving physical function, and reducing comorbidities, all of which contribute to better SRH [
16,
17]. Despite its established benefits in other chronic conditions, research examining the impact of PA on SRH in CKD remains limited. As both dietary adherence and PA are modifiable health behaviors, understanding their relationship with SRH could provide valuable insights for CKD management.
This study aimed to address this gap by analyzing data from the Korea National Health and Nutrition Examination Survey (KNHANES) to examine SRH and its associated factors, including dietary adherence and PA, among people with CKD.
Several factors have been identified as affecting SRH in individuals with CKD. Lee et al. [
12] reported that older patients (≥65 years) were less likely than younger patients to perceive their health as poor to fair. They also found that poor-to-fair SRH was associated with higher BMI and a greater burden of comorbidities. Similarly, Ko et al. [
7] identified multiple factors linked to poor SRH, including older age, current smoking, cardiovascular disease, diabetes, hypertension, impaired sleep, elevated C-reactive protein levels, and increased white blood cell counts. In addition, Lee and Suh [
10] found that household income, activity limitation, stress, and the number of comorbidities were significantly associated with subjective health status in people with CKD. Despite these findings, research on the factors influencing SRH in this population remains limited. Overall, SRH in people with CKD is affected by age, BMI, comorbidities, chronic diseases, lifestyle factors (such as smoking and impaired sleep), inflammatory markers, and psychosocial variables, including household income, activity limitation, and stress.
The association between dietary adherence, PA, and SRH in people with CKD remains underexplored. Studies on other chronic diseases, such as diabetes, metabolic syndrome, and cardiovascular disease, suggest that adherence to a healthy diet is linked to better SRH [
11]. Individuals with these conditions who follow dietary guidelines tend to perceive their health more positively [
5], while avoiding eating out has been associated with poorer SRH among those with multiple chronic conditions [
15]. Although dietary adherence is recognized as a determinant of SRH, findings remain inconsistent, and few studies have specifically investigated this relationship in people with CKD.
Previous studies have identified PA as a key determinant of SRH in individuals with multimorbidity [
11,
16]. Increased PA has been associated with better SRH, mitigating the negative impact of multimorbidity [
11,
16,
17]. Similarly, research on chronic obstructive pulmonary disease suggests that higher PA levels contribute to improved SRH [
17]. However, little is known about this relationship in people with CKD. Given that PA is a modifiable factor, understanding its role in SRH could help identify patients at risk for poorer health perceptions. This study may provide insights for developing nursing interventions to enhance SRH among people with CKD. This study was designed to describe SRH and to identify its associated factors, including dietary adherence and PA, among people with CKD.
METHODS
1. Study Design
This cross-sectional, descriptive, secondary analysis utilized data from the seventh KNHANES.
2. Setting and Samples
The KNHANES has been conducted annually by the Korea Centers for Disease Control and Prevention (now the Korea Disease Control and Prevention Agency) since 1998. The survey is designed to assess family health and nutritional status, monitor trends in health risk factors and the prevalence of major chronic diseases, and provide data for the development of health policies in Korea [
18]. This study used data from the seventh KNHANES, collected between 2016 and 2018, as it was the most recent dataset available at the time that included all essential variables required for analysis. The KNHANES is a population-based study of the health and nutritional status of the non-institutionalized civilian population of Korea [
18]. Participants are selected using a multistage, clustered, and stratified random sampling method, with proportional allocation based on geographic area, sex, and age group from national census data, to ensure a representative, nationwide sample. KNHANES excludes military personnel, prison inmates, hospital patients, children in nurseries, and individuals in social homes [
18]. For inclusion in this study, participants had to be at least 20 years old, have data for serum creatinine, and have an estimated glomerular filtration rate (eGFR) of 60 mL/min/1.73 m² or less [
19].
1) Demographic and clinical factors
Demographic and clinical factors in this study were selected based on findings from previous research involving people with CKD [
7,
10,
12]. Demographic factors included sex, age, income, education, marital status, and household members. These data were obtained from health interviews using a structured questionnaire.
Clinical factors included smoking history, alcohol consumption, anxiety/depression, BMI, comorbidities, and eGFR. All data were obtained from the health interviews except for body weight, height, and creatinine. Smoking history was categorized as current, past, or never smokers. Alcohol consumption was classified into three groups: none, 1 drink/month to 1 drink/week, or ≥2 drinks/week. Index scores from the EuroQol-5D (EQ-5D) questionnaire, an instrument for measuring health-related quality of life, were used to evaluate anxiety and depression. The EQ-5D includes five dimensions: mobility, self-care, usual activities, pain/discomfort, and anxiety/depression. For anxiety/depression, participants responded with one of the following: “I am not anxious or depressed,” “I am moderately anxious or depressed,” or “I am extremely anxious or depressed.” Responses were categorized as “yes” (moderately or extremely anxious/depressed) or “no” (not anxious/depressed). BMI was calculated as weight in kilograms divided by height in meters squared and classified as underweight (<18.5 kg/m²), normal (18.5–24.9 kg/m²), or overweight (≥25.0 kg/m²). Weight and height were measured directly by trained investigators using a stadiometer and scale, with participants wearing light clothing and no shoes [
18]. Comorbidities were defined based on participants’ self-reported history of physician-diagnosed diseases. These included cardiovascular, musculoskeletal, respiratory, neuropsychiatric, genitourinary, dermatological, endocrine-metabolic, eye and ear, gastrointestinal diseases, and cancer. The eGFR was calculated from serum creatinine levels using the CKD-EPI creatinine equation [
19]. Blood samples for serum creatinine were collected after at least an 8-hour fast, processed appropriately, immediately refrigerated, and transported in cold storage to a central laboratory within 24 hours [
18]. eGFR was classified into three categories according to the stages of kidney disease: stage 3, 30–59 mL/min/1.73 m²; stage 4, 15–29 mL/min/1.73 m²; and stage 5, <14 mL/min/1.73 m² [
19].
2) Dietary adherence
Dietary adherence was assessed using two questions from the health interviews: one on compliance with dietary therapy and one on restricting eating out [
18]. Participants were asked, “Are you complying with diet therapy for the underlying disease?” with responses of “yes” or “no.” Those who answered “yes” were expected to follow a therapeutic meal plan. The frequency of eating out was assessed with the question, “On average, how often did you eat out rather than have home-cooked food?”—including restaurant meals, delivery, take-out, and food service. Participants could choose from seven options: more than twice per day, once per day, 5 or 6 times per week, 3 or 4 times per week, 1 or 2 times per week, 1 to 3 times per month, or never (less than once per month). Responses were then classified as either “less than once per week” or “more than once per week.”
3) Physical activity
PA was measured using the Global Physical Activity Questionnaire (GPAQ), developed by the World Health Organization (WHO), which is widely used to evaluate PA levels [
20]. Participants responded to 15 questions regarding PA in three domains: activity at work, travel to and from places, and recreational activities. They were asked to specify both the number of days per week and the duration per day spent on each activity. For analysis, these three domains were divided into five subdomains: vigorous work, moderate work, transport, vigorous recreation, and moderate recreation, in accordance with the GPAQ guidelines [
21]. Total PA was calculated as the sum of the respective minutes spent in moderate and vigorous activities across all domains (work, transport, and recreation) within a week. To standardize the calculation, one minute of vigorous activity was converted into two minutes of moderate activity [
22]. Total PA was then classified into two categories: more than 150 minutes per week or 150 minutes or less per week, based on the WHO recommendation that adults engage in at least 150 minutes of moderate PA per week [
23].
4) Self-rated health
During the health interview, SRH was assessed using the question, “How do you rate your general health condition?” Participants rated their health as “very good,” “good,” “fair,” “poor,” or “very poor.” For analytical purposes, these five response options were grouped into two categories: good (very good, good, or fair) versus poor (poor or very poor). This dichotomous coding scheme—with three positive and two negative responses—has been commonly used in previous studies, as it improves statistical analysis and the interpretation of mean values [
24].
KNHANES questionnaires include three components: a health interview, a health examination, and a nutrition survey [
18]. These components collect detailed information on sociodemographic characteristics, health behaviors, medical conditions, biochemical profiles, and dietary intake using standardized procedures. Health interviews and examinations are conducted by trained medical staff and interviewers, while the nutrition survey is performed by dieticians. Health interview staff must complete intensive training and practice under supervision before beginning survey work. According to standardized protocols, all health examination procedures are performed by trained medical personnel, and all equipment is calibrated regularly. Detailed quality control instructions for the survey are available [
18].
The seventh KNHANES was approved by the institutional review board at the site where the original study was conducted. All surveys are performed with participants’ written consent to KNHANES. Ethical approval for this secondary data analysis was waived by the institutional review board of the institution where this analysis was conducted (No. 2021-0072-01).
6. Statistical Analysis
All statistical analyses were performed using SPSS software version 25.0 (IBM Corp., Armonk, NY, USA). Sampling weights were applied to all analyses to ensure representativeness of the Korean population. These sample weights accounted for the complex survey design, survey nonresponse, and post-stratification. Weights were constructed using the inverse of selection probabilities and response rates, and were further adjusted to reflect the sex- and age-specific structure of the Korean population (post-stratification).
Descriptive statistics were used to summarize the demographic and clinical characteristics of the sample and other study variables. Univariate and multivariate logistic regression analyses were conducted to identify factors associated with SRH. All variables were included in the multivariate logistic regression to determine independent associations with SRH. Odds ratios were presented with 95% confidence intervals. Statistical significance was defined as a two-tailed p-value of <.05.
RESULTS
1. Sample Characteristics and Study Variables
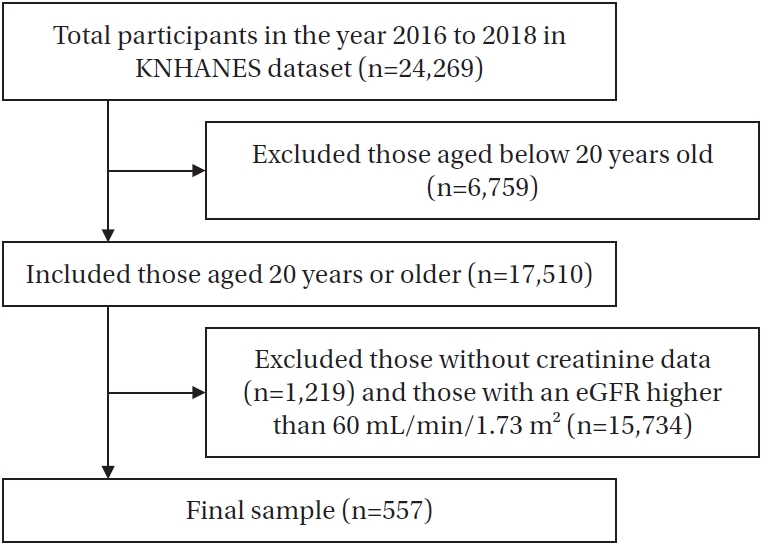
A total of 557 respondents with CKD were included in this study (
Figure 1). The mean age of participants was 74.7 years. Of the participants, 56.8% were men, and 40.4% were between 70 and 79 years old, representing the largest proportion in any age group. Approximately 59.8% of the sample had received a middle school education or less. The majority of participants had stage 3 CKD. Regarding dietary adherence, 394 participants (72.5%) reported not complying with dietary therapy. In terms of SRH, 320 (57.4%) reported good SRH, while 237 (42.6%) reported poor SRH (
Table 1).
Several variables were significantly associated with SRH among people with CKD in the univariate logistic regression analysis. Among demographic factors, older age and a mid-level household income ($786–2,355 per month) were significantly associated with better SRH, while a greater number of household members approached statistical significance. Regarding clinical factors, alcohol consumption of two or more times per week, absence of anxiety or depression, fewer comorbidities, and higher eGFR levels (15–59 mL/min/1.73 m²) were all positively associated with better SRH. In terms of PA, engaging in 150 minutes or more of PA per week was significantly associated with better SRH.
In the multivariate logistic regression analysis, several variables remained significant predictors of SRH. Among demographic factors, male sex and older age (≥70 years) were associated with better SRH, while mid-level household income approached significance. For clinical factors, both past and current smoking status, presence of anxiety or depression, and a higher number of comorbidities were negatively associated with good SRH. In contrast, participants with an eGFR of 15–59 mL/min/1.73 m² were more likely to report good SRH than their counterparts with lower eGFRs. As for PA, those who engaged in 150 minutes or more of PA per week had significantly higher odds of reporting good SRH (
Table 2).
DISCUSSION
Compared to previous studies reporting poor SRH in 31.1% [
7] and 38.6% [
10] of people with CKD, our study found a higher prevalence, with 42.6% of participants reporting poor SRH. Additionally, participants with CKD in this study were more likely to report poor SRH than those with diabetes or hypertension, at 39.7% [
9] and 37% [
8], respectively. This may be attributed to the greater self-management burden associated with CKD, including strict dietary restrictions and progressive decline in kidney function, which may present greater challenges than other chronic conditions [
25].
Various factors were found to be associated with SRH among people with CKD. We observed that men reported better SRH than women. Previous studies [
7,
12] have also demonstrated that men and women with CKD may differ in their health evaluations. Women tend to be more attentive to mild symptoms and minor chronic signs, whereas men focus more on life-threatening conditions [
7,
26]. These sex differences may contribute to variations in SRH among individuals with CKD.
Our findings indicate that older adults reported better SRH than younger people, possibly due to differences in health perceptions and behaviors. Younger people with CKD are more likely to engage in unhealthy behaviors, while older adults tend to adopt healthier lifestyles. Furthermore, older adults may have lower health expectations, leading to a more favorable perception of their status, whereas younger individuals’ higher expectations may result in lower SRH scores [
5,
12]. However, previous studies [
7] have reported conflicting results, suggesting a complex relationship between SRH and age. In older adults, SRH may align more closely with actual health changes, whereas younger people may exhibit greater variability due to diverse experiences and evolving perceptions [
27]. These findings underscore the need for further research to clarify the mechanisms influencing SRH across age groups.
In this study, participants in the middle household income group were 1.73 times more likely to report good SRH compared to those in the low-income group. Similarly, Lee and Suh [
10] reported a 2.25-fold increase, and Yoo et al. [
28] found a 1.19-fold increase, reinforcing the impact of income level on SRH. This can be explained by the fact that higher income improves access to healthcare and promotes healthier behaviors, leading to better SRH, whereas lower income is associated with neglect of health checkups and unhealthy habits [
10].
We found that smoking was negatively associated with better SRH, consistent with other studies [
7,
28]. Smoking is known to aggravate the progression of CKD and impair renal hemodynamics, which may influence how people with CKD perceive their health [
7,
29]. Thus, the adverse health effects of smoking could contribute to a more negative self-perception of health among this population.
We found a negative association between anxiety/depression and SRH among people with CKD. However, few studies have specifically examined depression and anxiety as factors related to SRH in CKD, making direct comparisons difficult. Rantanen et al. (2019) [
30] found that people with diabetes were more likely to report poor SRH if they experienced higher levels of anxiety or depression. Similarly, people with CKD often experience worsening symptoms over time, increasing the disease burden and leading to feelings of pressure and overwhelm [
31]. These factors can contribute to depressive moods and emotional disturbances, which may negatively affect individuals’ perceptions of their health. Therefore, further research is needed to explore the influence of psychiatric factors, such as anxiety and depression, on SRH in this population.
Consistent with previous studies [
7,
10,
12], we found that people with comorbidities were more likely to report poor SRH. Ko et al. [
7] showed that the presence of cardiovascular disease (2.68-fold), hypertension (1.29-fold), and diabetes (1.65-fold) increased the likelihood of poor SRH. Likewise, Lee et al. [
12] reported that individuals with cardiovascular disease, diabetes, and hypertension were more likely to perceive their health as poor. Furthermore, Lee and Suh [
10] found that people without comorbidities were 5.1 times more likely to report positive SRH compared to those with three or more comorbidities. This association may be explained by the increased risk of complications and severe health conditions with longer duration and greater number of diseases, leading to more negative overall health perceptions [
10,
12]. Consequently, health perception often reflects the illness experience among people with CKD and comorbidities [
32].
Increased eGFR was significantly associated with better SRH. Consistent with our findings, Lee et al. [
12] identified eGFR as a relevant factor for SRH, along with other hematological indicators such as albumin, creatinine, and hemoglobin. One possible explanation is that individuals undergoing renal replacement therapies, such as hemodialysis, may experience limitations in daily activities, reduced functional independence, and increased pessimism regarding their health due to physical impairments [
4,
33]. However, Ko et al. [
7] reported that eGFR did not significantly affect SRH, whereas inflammatory markers, including C-reactive protein and white blood cell counts, were significantly associated with SRH. These contrasting findings emphasize the need for further research to clarify the role of hematological factors as objective indicators of SRH.
This study found that engagement in PA was significantly associated with better SRH among people with CKD, in line with findings from research on chronic obstructive pulmonary disease [
17]. In our study, individuals who met the PA criteria had 1.88 times higher odds of reporting positive SRH, and similarly, those with chronic obstructive pulmonary disease had 2.22 times higher odds [
17]. Previous studies have also identified aerobic exercise, a variable closely related to PA, as a determinant of SRH in people with CKD [
28]. A physically active lifestyle has been shown to enhance health perception by improving functional capacity, increasing resilience, and reducing stress-related disease burden [
16,
34]. Based on our findings, emphasizing the value of increasing PA may help improve health perception among people with CKD.
We found no significant association between dietary adherence and SRH, which contrasts with previous studies. Additionally, prior research has reported conflicting findings regarding this relationship. Monteiro Dos Santos et al. [
15] found that people with chronic illnesses who adhered to healthy dietary patterns were more likely to report poor SRH, possibly due to the perceived burden of dietary restrictions. In contrast, Govindaraju et al. [
35] reported that greater adherence to the Dietary Approaches to Stop Hypertension diet was associated with better perceived health among people with cardiovascular disease. Adherence to therapeutic diets aimed at preventing disease progression can be perceived either as a psychological burden or as a positive health behavior [
11,
15]. This variation reflects how SRH evaluations may differ based on an individual's psychological state and socio-cultural context [
15,
35]. Future research should examine the psychological and socio-cultural factors that affect perceptions of dietary adherence and their impact on SRH in diverse chronic disease populations.
This study provides novel insights into factors associated with SRH, including PA, among people with CKD. Utilizing nationally representative data from the KNHANES, this study offers a comprehensive analysis of clinical and demographic correlates of SRH, contributing to nursing interventions aimed at improving SRH. Although these strengths are notable, several limitations should be acknowledged. First, as this was a cross-sectional study, a definite causal relationship between SRH and related factors cannot be established. Prospective studies are needed to clarify the temporal relationship between SRH and its associated factors among people with CKD. Second, because serum creatinine for calculating eGFR was measured at only one time point in KNHANES, a single eGFR value may not precisely reflect kidney function. Other indicators of kidney function, such as albuminuria or blood urea nitrogen, should be evaluated in people with CKD. Third, some variables associated with SRH, such as symptoms, could not be included because they were not available in the KNHANES dataset. Fourth, only two questions were used to assess dietary adherence, as this was all the KNHANES dataset provided; a structured questionnaire for dietary adherence was not included. These two questions may not fully capture the participants’ dietary adherence. Fifth, as PA was evaluated using a questionnaire, participants might have overestimated their usual activity levels. Sixth, because 90% of participants in this study had stage 3 CKD and only a few had stage 4 or stage 5, it is difficult to generalize the findings to those with advanced disease, such as end-stage renal disease.
Despite these limitations, this study highlights key determinants of SRH, emphasizing the role of modifiable factors like PA in improving perceived health. These findings can inform targeted nursing interventions to enhance well-being among people with CKD.
CONCLUSION
A notable proportion of Korean people with CKD perceived their health as poor, especially those with worse kidney function, multiple comorbidities, low levels of PA, or anxiety and depression, suggesting that clinical and behavioral factors play a key role in contributing to SRH. This study highlights the importance of understanding SRH and its associated factors among people with CKD. Based on the findings, the following recommendations are made: First, future research should focus on longitudinal studies to clarify the causal relationships between SRH and its associated factors in CKD patients, providing stronger evidence for interventions. Second, to enhance kidney function assessment, studies should incorporate biomarkers such as albuminuria alongside eGFR, offering a more comprehensive view of kidney health. Third, more detailed methods for assessing dietary adherence are needed, as current assessments may not fully capture participants' behaviors. Future studies should use comprehensive dietary assessments to better understand the role of nutrition in SRH. Fourth, further research should include CKD patients across all stages, especially those with advanced CKD, to improve the generalizability of findings. Lastly, nursing interventions should focus on promoting PA, with tailored exercise programs that address individual health profiles and barriers to exercise, to improve SRH and health outcomes.
This study expands academic understanding of SRH among individuals with CKD. By identifying associated factors within a community setting, it offers important insights into health perceptions in this population. These findings provide a foundation for future research aimed at developing and validating theoretical frameworks and evidence-based interventions. Given the nursing implications, it is essential that future nursing research develops and tests targeted interventions aimed at improving SRH, particularly through patient education, lifestyle counseling, and individualized health management strategies. Moreover, understanding SRH provides nurses with valuable insight into patients’ subjective health perceptions, enabling early identification of those at risk and the provision of more patient-centered, preventive care.
-
CONFLICTS OF INTEREST
The authors declared no conflict of interest.
-
AUTHORSHIP
Study conception & design acquisition - SKP and JL; analysis and interpretation of the data - SKP and JL; and drafting or critical revision of the manuscript for important intellectual content - SKP and JL.
-
FUNDING
None.
-
ACKNOWLEDGEMENT
None.
-
DATA AVAILABILITY STATEMENT
Data can be obtained from the Korea National Health and Nutrition Examination Survey (KNHANES) database, available from the Korea Disease Control and Prevention Agency (https://knhanes.kdca.go.kr).
Figure 1.Flowchart for the study sample. eGFR=estimated glomerular filtration rate; KNHANES=Korea National Health and Nutrition Examination Survey.

Table 1.Demographic and Clinical Factors, Dietary Adherence, and Physical Activity in People with Chronic Kidney Disease (N=557)
|
Variables |
Categories |
Total |
Self-rated health |
|
Good (n=320, 57.4%) |
Poor (n=237, 42.6%) |
|
M±SD or n (%) |
|
Sex |
Female |
263 (43.2) |
141 (39.7) |
122 (48.4) |
|
Male |
294 (56.8) |
179 (60.3) |
115 (51.6) |
|
Age (year) |
|
74.75±7.56 |
76.26±6.98 |
72.74±7.13 |
|
<60 |
47 (11.9) |
20 (8.2) |
27 (17.5) |
|
60–69 |
105 (18.3) |
53 (16.3) |
52 (21.2) |
|
70–79 |
234 (40.4) |
138 (43.0) |
96 (36.5) |
|
≥80 |
171 (29.5) |
109 (32.5) |
62 (24.8) |
|
Income ($) |
<785 |
296 (47.9) |
151 (42.3) |
145 (56.4) |
|
786–2,355 |
193 (36.8) |
126 (41.7) |
67 (29.4) |
|
>2,355 |
68 (15.2) |
43 (16.0) |
25 (14.1) |
|
Education |
≤Middle school |
369 (59.8) |
209 (59.0) |
160 (60.9) |
|
High school |
115 (22.9) |
60 (20.7) |
55 (26.2) |
|
≥College |
73 (17.4) |
51 (20.3) |
22 (12.9) |
|
Marital status |
Single |
209 (35.3) |
111 (32.7) |
98 (39.3) |
|
Married |
348 (64.7) |
209 (67.3) |
139 (60.7) |
|
Household members |
1 |
140 (20.1) |
71 (16.7) |
69 (25.1) |
|
2 |
254 (42.5) |
149 (44.4) |
105 (39.7) |
|
≥3 |
163 (37.4) |
100 (38.9) |
63 (35.2) |
|
Smoking |
None |
310 (53.7) |
186 (56.5) |
124 (49.4) |
|
Past |
181 (33.3) |
99 (32.2) |
82 (34.9) |
|
Current |
66 (13.1) |
35 (11.3) |
31 (15.7) |
|
Alcohol consumption |
None |
383 (68.3) |
206 (63.6) |
177 (75.3) |
|
1 drink/month–1 drink/week |
145 (27.0) |
98 (32.6) |
47 (18.4) |
|
≥2 drinks/week |
29 (4.7) |
16 (3.8) |
13 (6.3) |
|
Anxiety/depression |
No |
481 (87.4) |
300 (94.2) |
181 (77.0) |
|
Yes |
76 (12.6) |
20 (5.8) |
56 (23.0) |
|
BMI (kg/m2) |
<18.5 |
12 (2.8) |
6 (1.8) |
6 (4.4) |
|
18.5–24.9 |
298 (54.4) |
175 (56.0) |
123 (52.0) |
|
≥25.0 |
247 (42.7) |
139 (42.2) |
108 (43.6) |
|
No. of comorbidities |
0 |
109 (21.3) |
81 (27.0) |
28 (12.7) |
|
1 |
177 (30.5) |
102 (29.8) |
75 (31.6) |
|
2 |
135 (23.8) |
75 (22.7) |
60 (25.6) |
|
3 |
79 (14.1) |
36 (11.9) |
43 (17.3) |
|
≥4 |
57 (10.3) |
26 (8.6) |
31 (12.7) |
|
eGFR (mL/min/1.73 m2) |
|
42.3±6.9 |
42.6±4.8 |
41.7±5.3 |
|
30–59 |
505 (90.7) |
302 (94.3) |
203 (85.6) |
|
15–29 |
38 (5.9) |
17 (5.3) |
21 (8.8) |
|
<14 |
14 (2.5) |
1 (0.4) |
13 (5.6) |
|
Compliance with dietary therapy |
Yes |
163 (27.5) |
81 (24.2) |
82 (32.4) |
|
No |
394 (72.5) |
239 (75.8) |
155(67.6) |
|
Restriction on eating out |
Less than once per week |
252 (49.6) |
154 (48.1) |
98 (41.3) |
|
More than once per week |
305 (50.4) |
166 (51.9) |
139 (58.7) |
|
Physical activity (minute/week) |
|
235±280 |
270±270 |
166±188 |
|
≥150 |
143 (27.8) |
96 (31.6) |
47 (21.9) |
|
<150 |
414 (72.2) |
224 (68.4) |
190 (78.1) |
Table 2.Related Factors for Self-Rated Health in People with Chronic Kidney Disease, Using Univariate and Multivariate Logistic Regression
|
Variables |
Unadjusted |
Adjusted |
|
OR (95% CI) |
p
|
OR (95% CI) |
p
|
|
Demographic factors |
|
|
|
|
|
Sex |
|
|
|
|
|
Female |
1 |
|
1 |
|
|
Male |
1.42 (0.96–2.11) |
.081 |
2.64 (1.28–5.45) |
.015 |
|
Age (year) |
|
|
|
|
|
<60 |
1 |
|
1 |
|
|
60–69 |
1.64 (0.73–3.67) |
.237 |
1.81 (0.68–4.81) |
.234 |
|
70–79 |
2.51 (1.24–5.09) |
.014 |
4.75 (1.70–13.30) |
.003 |
|
≥80 |
2.79 (1.32–5.88) |
.013 |
5.36 (1.81–15.87) |
.005 |
|
Income ($) |
|
|
|
|
|
<785 |
1 |
|
1 |
|
|
786–2,355 |
1.89 (1.23–2.90) |
.001 |
1.73 (1.00–3.00) |
.051 |
|
>2,355 |
1.51 (0.82–2.78) |
.191 |
1.64 (0.74–3.62) |
.223 |
|
Education |
|
|
|
|
|
≤Middle school |
1 |
|
1 |
|
|
High school |
0.82 (0.49–1.35) |
.433 |
0.71 (0.38–1.33) |
.291 |
|
≥College |
1.62 (0.87–3.04) |
.133 |
1.02 (0.46–2.28) |
.964 |
|
Marital status |
|
|
|
|
|
Single |
1 |
|
1 |
|
|
Married |
1.33 (0.88–2.02) |
.187 |
1.33 (0.70–2.52) |
.385 |
|
Household members |
|
|
|
|
|
1 |
1 |
|
1 |
|
|
2 |
1.68 (1.04–2.71) |
.046 |
0.87 (0.42–1.77) |
.691 |
|
≥3 |
1.66 (1.01–2.72) |
.051 |
1.03 (0.49–2.18) |
.932 |
|
Clinical factors |
|
|
|
|
|
Smoking |
|
|
|
|
|
None |
1 |
|
1 |
|
|
Past |
0.63 (0.33–1.20) |
.161 |
0.25 (0.12–0.53) |
.007 |
|
Current |
0.81 (0.52–1.27) |
.367 |
0.28 (0.12–0.65) |
.002 |
|
Alcohol consumption |
|
|
|
|
|
None |
1 |
|
1 |
|
|
1 drink/month–1 drink/week |
0.71 (0.29–1.70) |
.447 |
1.72 (0.99–2.97) |
.061 |
|
≥2 drinks/week |
2.09 (1.30–3.38) |
.004 |
0.79 (0.26–2.39) |
.685 |
|
Anxiety/depression |
|
|
|
|
|
No |
1 |
|
1 |
|
|
Yes |
0.21 (0.11–0.38) |
.006 |
0.17 (0.08–0.35) |
.008 |
|
BMI (kg/m2) |
|
|
|
|
|
<18.5 |
1 |
|
1 |
|
|
18.5–24.9 |
2.70 (0.77–9.46) |
.125 |
0.99 (0.25–3.88) |
.997 |
|
≥25.0 |
2.42 (0.72–8.17) |
.157 |
0.91 (0.24–3.46) |
.893 |
|
No. of comorbidities |
|
|
|
|
|
0 |
1 |
|
1 |
|
|
1 |
0.44 (0.23–0.85) |
.025 |
0.33 (0.16–0.66) |
.003 |
|
2 |
0.42 (0.21–0.81) |
.017 |
0.37 (0.18–0.73) |
.015 |
|
3 |
0.32 (0.15–0.67) |
.006 |
0.27 (0.12–0.60) |
.004 |
|
≥4 |
0.32 (0.14–0.72) |
.013 |
0.31 (0.12–0.77) |
.017 |
|
eGFR (mL/min/1.73 m2) |
|
|
|
|
|
30–59 |
56.87 (7.76–416.77) |
.004 |
16.12 (1.75–148.43) |
.014 |
|
15–29 |
21.56 (2.89–160.67) |
.006 |
40.55 (4.25–386.78) |
.007 |
|
<14 |
1 |
|
1 |
|
|
Dietary adherence |
|
|
|
|
|
Compliance with dietary therapy |
|
|
|
|
|
Yes |
0.67 (0.44–1.01) |
.061 |
0.91 (0.56–1.47) |
.702 |
|
No |
1 |
|
1 |
|
|
Restriction on eating out |
|
|
|
|
|
Less than once per week |
0.83 (0.55–1.23) |
.351 |
0.69 (0.41–1.18) |
.188 |
|
More than once per week |
1 |
|
1 |
|
|
Physical activity (minute/week) |
|
|
|
|
|
≥150 |
1.68 (1.05–2.72) |
.044 |
1.88 (1.09–3.37) |
.046 |
|
<150 |
1 |
|
1 |
|
REFERENCES
- 1. International Society of Nephrology; International Federation of Kidney Foundations. World kidney day: activities guide. Brussels: International Society of Nephrology; 2023.
- 2. Choi S, Jeong GS, Kweon S. 2023 World Kidney Day. Public Health Wkly Rep. 2023;16(11):321-6. https://doi.org/10.56786/PHWR.2023.16.11.2
- 3. Korea Disease Control and Prevention Agency. Korea health statistics 2021: Korea national health and nutrition examination survey (KNHANES VIII-3). Cheongju: KDCA; 2022.
- 4. Aguiar LK, Ladeira RM, Machado IE, Bernal RT, Moura L, Malta DC. Factors associated with chronic kidney disease, according to laboratory criteria of the National Health Survey. Rev Bras Epidemiol. 2020;23:e200101. https://doi.org/10.1590/1980-549720200101
- 5. Grove BE, Schougaard LM, Hjollund NH, Ivarsen P. Self-rated health, quality of life and appetite as predictors of initiation of dialysis and mortality in patients with chronic kidney disease stages 4-5: a prospective cohort study. BMC Res Notes. 2018;11(1):371. https://doi.org/10.1186/s13104-018-3472-9
- 6. Clark-Cutaia MN, Sevick MA, Thurheimer-Cacciotti J, Hoffman LA, Snetselaar L, Burke LE, et al. Perceived barriers to adherence to hemodialysis dietary recommendations. Clin Nurs Res. 2019;28(8):1009-29. https://doi.org/10.1177/1054773818773364
- 7. Ko HL, Min HK, Lee SW. Self-rated health and the risk of incident chronic kidney disease: a community-based Korean study. J Nephrol. 2023;36(3):745-53. https://doi.org/10.1007/s40620-022-01518-3
- 8. Han KM, Ko YH, Yoon HK, Han C, Ham BJ, Kim YK. Relationship of depression, chronic disease, self-rated health, and gender with health care utilization among community-living elderly. J Affect Disord. 2018;241:402-10. https://doi.org/10.1016/j.jad.2018.08.044
- 9. Yang H, Deng Q, Geng Q, Tang Y, Ma J, Ye W, et al. Association of self-rated health with chronic disease, mental health symptom and social relationship in older people. Sci Rep. 2021;11(1):14653. https://doi.org/10.1038/s41598-021-94318-x
- 10. Lee J, Suh Y. Good subjective health status and health-related quality of life in people with chronic kidney disease: a secondary analysis using the Korea National Health and Nutritional Examination Survey in 2019 and 2020. Res Community Public Health Nurs. 2023;34(4):255-66. https://doi.org/10.12799/rcphn.2023.00262
- 11. Aguilar-Palacio I, Gil-Lacruz AI, Sanchez-Recio R, Rabanaque MJ. Self-rated health in Europe and its determinants: does generation matter? Int J Public Health. 2018;63(2):223-32. https://doi.org/10.1007/s00038-018-1079-5
- 12. Lee J, Abdel-Kader K, Yabes JG, Cai M, Chang HH, Jhamb M. Association of self-rated health with functional limitations in patients with CKD. Kidney Med. 2021;3(5):745-52.e1. https://doi.org/10.1016/j.xkme.2021.04.010
- 13. Ojelabi AO, Graham Y, Haighton C, Ling J. A systematic review of the application of Wilson and Cleary health-related quality of life model in chronic diseases. Health Qual Life Outcomes. 2017;15(1):241. https://doi.org/10.1186/s12955-017-0818-2
- 14. Beerendrakumar N, Ramamoorthy L, Haridasan S. Dietary and fluid regime adherence in chronic kidney disease patients. J Caring Sci. 2018;7(1):17-20. https://doi.org/10.15171/jcs.2018.003
- 15. Monteiro Dos Santos JE, Crispim SP, Murphy J, de Camargo Cancela M. Health, lifestyle and sociodemographic characteristics are associated with Brazilian dietary patterns: Brazilian National Health Survey. PLoS One. 2021;16(2):e0247078. https://doi.org/10.1371/journal.pone.0247078
- 16. Marques A, Peralta M, Gouveia ER, Chavez FG, Valeiro MG. Physical activity buffers the negative relationship between multimorbidity, self-rated health and life satisfaction. J Public Health (Oxf). 2018;40(3):e328-35. https://doi.org/10.1093/pubmed/fdy012
- 17. Stevens D, Andreou P, Rainham D. Environmental correlates of physical activity, sedentary behavior, and self-rated health in chronic obstructive pulmonary disease. J Cardiopulm Rehabil Prev. 2022;42(3):190-5. https://doi.org/10.1097/hcr.0000000000000628
- 18. Korea Disease Control and Prevention Agency. Korea national helath & nutrition examination survey [Internet]. Cheongju: KDCA; 2021 [cited 2025 July 26]. Available from: https://knhanes.kdca.go.kr/knhanes/surveyIntr/otln.do
- 19. Inker LA, Eneanya ND, Coresh J, Tighiouart H, Wang D, Sang Y, et al. New creatinine- and cystatin C-based equations to estimate GFR without race. N Engl J Med. 2021;385(19):1737-49. https://doi.org/10.1056/NEJMoa2102953
- 20. Sung H, Kim G, Ma X, Choe H, Han Y, Yoon J, et al. Physical activity trends in Korean adults from Korea National Health and Nutritional Examination Survey from 2014 to 2019. Int J Environ Res Public Health. 2022;19(9):5213. https://doi.org/10.3390/ijerph19095213
- 21. World Health Organization. Global Physical Activity Questionnaire (GPAQ) analysis guide [Internet]. Geneva: WHO; 2012 [cited 2025 July 26]. Available from: https://www.cdc.gov/physical-activity-basics/guidelines/adults.html?CDC_AAref_Val=https://www.cdc.gov/physicalactivity/basics/adults/index.htm
- 22. Centers for Disease Control and Prevention. How much physical activity do adults need? [Internet]. Atlanta, GA: CDC; 2022 [cited 2025 July 26]. Available from: https://www.cdc.gov/physical-activity-basics/guidelines/adults.html
- 23. World Health Organization. Physical activity [Internet]. Geneva: WHO; 2022 [cited 2025 July 26]. Available from: https://www.who.int/news-room/fact-sheets/detail/physical-activity
- 24. Cullati S, Bochatay N, Rossier C, Guessous I, Burton-Jeangros C, Courvoisier DS. Does the single-item self-rated health measure the same thing across different wordings? Construct validity study. Qual Life Res. 2020;29(9):2593-604. https://doi.org/10.1007/s11136-020-02533-2
- 25. Adejumo OA, Iyawe IO, Akinbodewa AA, Abolarin OS, Alli EO. Burden, psychological well-being and quality of life of caregivers of end stage renal disease patients. Ghana Med J. 2019;53(3):190-6. https://doi.org/10.4314/gmj.v53i3.2
- 26. Jatrana S. Gender differences in self-reported health and psychological distress among New Zealand adults. Demogr Res. 2021;45:693-726. https://doi.org/10.4054/DemRes.2021.45.21
- 27. Uchino BN, Birmingham W, Landvatter J, Cronan S, Scott E, Smith TW. Self-rated health and age-related differences in ambulatory blood pressure: the mediating role of behavioral and affective factors. Psychosom Med. 2020;82(4):402-8. https://doi.org/10.1097/psy.0000000000000795
- 28. Yoo CS, Kim Y, Kim HY. Impact of chronic kidney disease on depression, perceived health, and health-related quality of life: results from the Korea National Health and Nutrition Examination Survey in 2014 and 2016. Korean J Adult Nurs. 2020;32(4):374-84. https://doi.org/10.7475/kjan.2020.32.4.374
- 29. Choi HS, Han KD, Oh TR, Kim CS, Bae EH, Ma SK, et al. Smoking and risk of incident end-stage kidney disease in general population: a nationwide population-based cohort study from Korea. Sci Rep. 2019;9(1):19511. https://doi.org/10.1038/s41598-019-56113-7
- 30. Rantanen AT, Korkeila JJA, Kautiainen H, Korhonen PE. Poor or fair self-rated health is associated with depressive symptoms and impaired perceived physical health: a cross-sectional study in a primary care population at risk for type 2 diabetes and cardiovascular disease. Eur J Gen Pract. 2019;25(3):143-8. https://doi.org/10.1080/13814788.2019.1635114
- 31. Lv JC, Zhang LX. Prevalence and disease burden of chronic kidney disease. Adv Exp Med Biol. 2019;1165:3-15. https://doi.org/10.1007/978-981-13-8871-2_1
- 32. Ng JH, Vialet J, Diefenbach MA. Illness perception in patients with chronic kidney disease and kidney failure: a scoping review protocol. BMJ Open. 2021;11(2):e042298. https://doi.org/10.1136/bmjopen-2020-042298
- 33. Gravina EPL, Pinheiro BV, Jesus L, Barros FS, Lucinda LMF, Colugnati FAB, et al. Factors associated with functional capacity in CKD patients. Clin Nurs Res. 2021;30(3):351-9. https://doi.org/10.1177/1054773820958540
- 34. Pengpid S, Peltzer K. Physical activity, health and well-being among a nationally representative population-based sample of middle-aged and older adults in India, 2017-2018. Heliyon. 2021;7(12):e08635. https://doi.org/10.1016/j.heliyon.2021.e08635
- 35. Govindaraju T, Sahle BW, McCaffrey TA, McNeil JJ, Owen AJ. Dietary patterns and quality of life in older adults: a systematic review. Nutrients. 2018;10(8):971. https://doi.org/10.3390/nu10080971


 E-SUBMISSION
