

1Department of Nursing, Daedong College, Busan
2Department of Nursing, Dong-A University, Busan, Korea
Copyright © 2014 Korean Society of Adult Nursing
This is an Open Access article distributed under the terms of the Creative Commons Attribution Non-Commercial License (http://creativecommons.org/licenses/by-nc/3.0) which permits unrestricted non-commercial use, distribution, and reproduction in any medium, provided the original work is properly cited.
| Characteristics | Categories | n(%) | |
|---|---|---|---|
| Experience of violent behavior (n=447) | Yes | 123 (27.5) | |
| No | 324 (72.5) | ||
| Time of violence | 00:00~08:00 | 63 (51.2) | |
| 08:00~16:00 | 14 (11.4) | ||
| 16:00~24:00 | 46 (37.4) | ||
| Types of violent † | Verbal violence | Had yelled | 116 (94.3) |
| Talked down | 75 (61.0) | ||
| Had curse | 62 (50.4) | ||
| Had threatened | 26 (21.1) | ||
| Physical threat | Grim expression to medical workers | 56 (45.5) | |
| Walk to and fro with rage in ER | 37 (30.1) | ||
| Square off to medical worker | 19 (15.4) | ||
| Posed throwing a stuff | 13 (10.5) | ||
| Kick at stuff of hospital | 12 (9.8) | ||
| Physical violence | Push medical worker | 12 (9.8) | |
| Grab medical worker's throats | 10 (8.1) | ||
| Hit or kick medical worker | 7 (5.7) | ||
| Medical worker was hit by thrown objects | 6 (4.9) | ||
| Spit in a medical worker's face | 6 (4.9) | ||
| Bite medical worker | 3 (2.4) | ||
| Scratch medical worker | 1 (0.8) | ||
| Variables | Characteristics | Categories | Yes (n=123)† | No (n=324)† | x2 | p |
|---|---|---|---|---|---|---|
| n (%) | n (%) | |||||
| General | Gender | Male | 59 (48.0) | 126 (38.9) | 3.03 | .082 |
| Female | 64 (52.0) | 198 (61.1) | ||||
| Age (year) | 20~29 | 27 (22.0) | 40 (12.3) | 9.19 | .057 | |
| 30~39 | 16 (13.0) | 62 (19.1) | ||||
| 40~49 | 25 (20.3) | 66 (20.4) | ||||
| 50~59 | 28 (22.8) | 64 (19.8) | ||||
| ≥60 | 27 (22.0) | 92 (28.4) | ||||
| Patient/caregiver | Patient | 60 (48.8) | 177 (54.6) | 1.22 | .268 | |
| Caregiver | 63 (51.2) | 147 (45.4) | ||||
| Relationships with patients | Patient | 60 (48.8) | 177 (54.6) | 19.05 | .002 | |
| Parents | 15 (12.2) | 69 (21.3) | ||||
| Offspring | 15 (12.2) | 32 (9.9) | ||||
| Spouse | 13 (10.6) | 16 (4.9) | ||||
| Friend | 13 (10.6) | 10 (3.1) | ||||
| Other | 7 (5.7) | 20 (6.2) | ||||
| Experience of discontent expression during ER care in the past | Yes | 38 (30.9) | 30 (9.3) | 32.86 | <.001 | |
| No | 84 (69.1) | 294 (90.7) | ||||
| Situational | Hospital | Advanced general hospital | 20 (16.3) | 58 (17.9) | 0.54 | .762 |
| General hospital | 100 (81.3) | 261 (80.6) | ||||
| Hospital | 3 (2.4) | 5 (1.5) | ||||
| Medical department | Internal‡ | 54 (44.6) | 160 (50.6) | 6.42 | .093 | |
| Surgical§ | 31 (25.6) | 89 (28.2) | ||||
| Pediatric | 7 (5.8) | 23 (7.3) | ||||
| Others|| | 29 (24.0) | 44 (13.9) | ||||
| Drinking alcohol | Drinking | 17 (13.9) | 15 (4.7) | 11.25 | .001 | |
| Non-drinking | 105 (86.1) | 305 (95.3) | ||||
| Critical condition level | Very critical | 60 (48.8) | 96 (29.8) | 15.97 | <.001 | |
| Critical | 41 (33.3) | 168 (52.2) | ||||
| Neutral/non | 21 (17.9) | 58 (18.0) | ||||
| Pain level | Very severe | 67 (54.9) | 132 (41.0) | 7.36 | .025 | |
| Severe | 41 (33.6) | 150 (46.6) | ||||
| Neutral/non | 14 (11.5) | 40 (12.4) | ||||
| Anxiety level of subject | Very anxious | 73 (59.8) | 136 (42.1) | 11.56 | .003 | |
| Anxious | 36 (29.5) | 146 (45.2) | ||||
| Neutral/non | 13 (10.7) | 41 (12.7) | ||||
| Discontent level about the deteriorated condition, when treated or waited | Very discontent | 42 (34.4) | 26 (8.1) | 81.54 | <.001 | |
| Discontent | 54 (44.3) | 85 (26.4) | ||||
| Neutral/non | 26 (21.3) | 211 (65.5) |
| Variables | B | SE | Wald | p | OR | 95% CI |
|---|---|---|---|---|---|---|
| Gender (1=male, 0=female†) | 0.30 | 0.29 | 1.09 | .297 | 1.35 | 0.77~2.38 |
| Age | 0.02 | 0.10 | 0.02 | .882 | 1.02 | 0.83~1.24 |
| Relationships with patients (1=friends, 0=others†) | 1.80 | 0.60 | 9.13 | .003 | 6.06 | 1.88~19.49 |
| Drinking alcohol (1=drinking, 0=non-drinking*) | 1.37 | 0.51 | 7.12 | .008 | 3.93 | 1.44~10.75 |
| Experience of discontent expression during ER care in the past (1=yes, 0=no†) | 0.96 | 0.34 | 8.10 | .004 | 2.62 | 1.35~5.10 |
| Critical condition level of patients | 0.28 | 0.26 | 1.10 | .293 | 1.32 | 0.79~2.20 |
| Pain level of patients | -0.09 | 0.26 | 0.12 | .729 | 0.91 | 0.55~1.52 |
| Anxiety level of subject | -0.11 | 0.27 | 0.16 | .688 | 0.90 | 0.53~1.51 |
| Discontent level about the deteriorated condition, when | 0.61 | 0.20 | 9.41 | .002 | 1.84 | 1.25~2.72 |
| treated or waited | ||||||
| Attitudes perceived by subjects when medical workers responded to them‡ | 0.46 | 0.37 | 1.54 | .215 | 1.58 | 0.77~3.26 |
| Attitudes perceived by subjects when medical workers gave explanations to them‡ | 0.77 | 0.27 | 8.14 | .004 | 2.15 | 1.27~3.65 |
| Proficiency perceived by subjects when medical workers treated to them‡ | 0.56 | 0.27 | 4.44 | .035 | 1.75 | 1.04~2.96 |
| Delay in medical treatment hour | 0.61 | 0.23 | 6.91 | .009 | 1.84 | 1.17~2.90 |
| Propriety of medical treatment condition | -0.01 | 0.32 | 0.00 | .973 | 0.99 | 0.53~1.86 |

The State of Affairs of Violent Behavior for Medical Staffs of Patient or Caregiver (N=447)
| Characteristics | Categories | n(%) | |
|---|---|---|---|
| Experience of violent behavior (n=447) | Yes | 123 (27.5) | |
| No | 324 (72.5) | ||
| Time of violence | 00:00~08:00 | 63 (51.2) | |
| 08:00~16:00 | 14 (11.4) | ||
| 16:00~24:00 | 46 (37.4) | ||
| Types of violent |
Verbal violence | Had yelled | 116 (94.3) |
| Talked down | 75 (61.0) | ||
| Had curse | 62 (50.4) | ||
| Had threatened | 26 (21.1) | ||
| Physical threat | Grim expression to medical workers | 56 (45.5) | |
| Walk to and fro with rage in ER | 37 (30.1) | ||
| Square off to medical worker | 19 (15.4) | ||
| Posed throwing a stuff | 13 (10.5) | ||
| Kick at stuff of hospital | 12 (9.8) | ||
| Physical violence | Push medical worker | 12 (9.8) | |
| Grab medical worker's throats | 10 (8.1) | ||
| Hit or kick medical worker | 7 (5.7) | ||
| Medical worker was hit by thrown objects | 6 (4.9) | ||
| Spit in a medical worker's face | 6 (4.9) | ||
| Bite medical worker | 3 (2.4) | ||
| Scratch medical worker | 1 (0.8) | ||
ER=Emergency room;
†Multiple response.
Differences of Personal Factors according to the Experience of Violent Behavior (N=447)
| Variables | Characteristics | Categories | Yes (n=123) |
No (n=324) |
x2 | p |
|---|---|---|---|---|---|---|
| n (%) | n (%) | |||||
| General | Gender | Male | 59 (48.0) | 126 (38.9) | 3.03 | .082 |
| Female | 64 (52.0) | 198 (61.1) | ||||
| Age (year) | 20~29 | 27 (22.0) | 40 (12.3) | 9.19 | .057 | |
| 30~39 | 16 (13.0) | 62 (19.1) | ||||
| 40~49 | 25 (20.3) | 66 (20.4) | ||||
| 50~59 | 28 (22.8) | 64 (19.8) | ||||
| ≥60 | 27 (22.0) | 92 (28.4) | ||||
| Patient/caregiver | Patient | 60 (48.8) | 177 (54.6) | 1.22 | .268 | |
| Caregiver | 63 (51.2) | 147 (45.4) | ||||
| Relationships with patients | Patient | 60 (48.8) | 177 (54.6) | 19.05 | .002 | |
| Parents | 15 (12.2) | 69 (21.3) | ||||
| Offspring | 15 (12.2) | 32 (9.9) | ||||
| Spouse | 13 (10.6) | 16 (4.9) | ||||
| Friend | 13 (10.6) | 10 (3.1) | ||||
| Other | 7 (5.7) | 20 (6.2) | ||||
| Experience of discontent expression during ER care in the past | Yes | 38 (30.9) | 30 (9.3) | 32.86 | <.001 | |
| No | 84 (69.1) | 294 (90.7) | ||||
| Situational | Hospital | Advanced general hospital | 20 (16.3) | 58 (17.9) | 0.54 | .762 |
| General hospital | 100 (81.3) | 261 (80.6) | ||||
| Hospital | 3 (2.4) | 5 (1.5) | ||||
| Medical department | Internal |
54 (44.6) | 160 (50.6) | 6.42 | .093 | |
| Surgical |
31 (25.6) | 89 (28.2) | ||||
| Pediatric | 7 (5.8) | 23 (7.3) | ||||
| Others |
29 (24.0) | 44 (13.9) | ||||
| Drinking alcohol | Drinking | 17 (13.9) | 15 (4.7) | 11.25 | .001 | |
| Non-drinking | 105 (86.1) | 305 (95.3) | ||||
| Critical condition level | Very critical | 60 (48.8) | 96 (29.8) | 15.97 | <.001 | |
| Critical | 41 (33.3) | 168 (52.2) | ||||
| Neutral/non | 21 (17.9) | 58 (18.0) | ||||
| Pain level | Very severe | 67 (54.9) | 132 (41.0) | 7.36 | .025 | |
| Severe | 41 (33.6) | 150 (46.6) | ||||
| Neutral/non | 14 (11.5) | 40 (12.4) | ||||
| Anxiety level of subject | Very anxious | 73 (59.8) | 136 (42.1) | 11.56 | .003 | |
| Anxious | 36 (29.5) | 146 (45.2) | ||||
| Neutral/non | 13 (10.7) | 41 (12.7) | ||||
| Discontent level about the deteriorated condition, when treated or waited | Very discontent | 42 (34.4) | 26 (8.1) | 81.54 | <.001 | |
| Discontent | 54 (44.3) | 85 (26.4) | ||||
| Neutral/non | 26 (21.3) | 211 (65.5) |
ER=emergency room;
†No respondent excluded;
‡Internal (Internal medicine, Neurology);
§Surgical (General surgery, Neurosurgery, Orthopedic surgery, Plastic surgery);
||Others (Ophthalmology, Obstetrics, etc.).
Difference of Interpersonal Factors and Institutional Factors according to the Experience of Violent Behavior (N=447)
| Factors | Characteristics | Yes (n=123) | No (n=324) | t | p | |
|---|---|---|---|---|---|---|
| Interpersonal factors | Attitudes perceived by subjects when medical workers responded to them | 2.16±0.54 | 2.71±0.55 | 9.32 | <.001 | |
| Attitudes perceived by subjects when medical workers gave explanations to them | 2.28±0.72 | 2.86±0.65 | 7.80 | <.001 | ||
| Proficiency perceived by subjects when medical workers treated to them | 2.45±0.55 | 2.91±0.63 | 7.08 | <.001 | ||
| Subtotal | 2.30±0.49 | 2.83±0.51 | 9.81 | <.001 | ||
| Institutional factors | Delay in medical treatment hour | Standby for medical treatment | 3.34±0.79 | 2.61±0.86 | -8.14 | <.001 |
| Admission or discharge | 3.15±0.84 | 2.43±0.82 | -8.22 | <.001 | ||
| Emergency care or surgery, or tests | 2.93±0.95 | 2.34±0.90 | -6.00 | <.001 | ||
| Subtotal | 3.14±0.73 | 2.46±0.74 | -8.72 | <.001 | ||
| Propriety of medical treatment condition | Medical expenses | 1.87±0.79 | 2.07±0.78 | 2.45 | .015 | |
| Numbers of medical workers | 2.02±0.74 | 2.48±0.68 | 6.09 | <.001 | ||
| Environment of ER | 1.89±0.76 | 2.44±0.71 | 7.21 | <.001 | ||
| Subtotal | 1.93±0.58 | 2.33±0.53 | 6.99 | <.001 | ||
ER=emergency room.
Predictors of Violent Behavior by Patient or Caregiver in the Emergency Department (N=447)
| Variables | B | SE | Wald | p | OR | 95% CI |
|---|---|---|---|---|---|---|
| Gender (1=male, 0=female |
0.30 | 0.29 | 1.09 | .297 | 1.35 | 0.77~2.38 |
| Age | 0.02 | 0.10 | 0.02 | .882 | 1.02 | 0.83~1.24 |
| Relationships with patients (1=friends, 0=others |
1.80 | 0.60 | 9.13 | .003 | 6.06 | 1.88~19.49 |
| Drinking alcohol (1=drinking, 0=non-drinking*) | 1.37 | 0.51 | 7.12 | .008 | 3.93 | 1.44~10.75 |
| Experience of discontent expression during ER care in the past (1=yes, 0=no |
0.96 | 0.34 | 8.10 | .004 | 2.62 | 1.35~5.10 |
| Critical condition level of patients | 0.28 | 0.26 | 1.10 | .293 | 1.32 | 0.79~2.20 |
| Pain level of patients | -0.09 | 0.26 | 0.12 | .729 | 0.91 | 0.55~1.52 |
| Anxiety level of subject | -0.11 | 0.27 | 0.16 | .688 | 0.90 | 0.53~1.51 |
| Discontent level about the deteriorated condition, when | 0.61 | 0.20 | 9.41 | .002 | 1.84 | 1.25~2.72 |
| treated or waited | ||||||
| Attitudes perceived by subjects when medical workers responded to them |
0.46 | 0.37 | 1.54 | .215 | 1.58 | 0.77~3.26 |
| Attitudes perceived by subjects when medical workers gave explanations to them |
0.77 | 0.27 | 8.14 | .004 | 2.15 | 1.27~3.65 |
| Proficiency perceived by subjects when medical workers treated to them |
0.56 | 0.27 | 4.44 | .035 | 1.75 | 1.04~2.96 |
| Delay in medical treatment hour | 0.61 | 0.23 | 6.91 | .009 | 1.84 | 1.17~2.90 |
| Propriety of medical treatment condition | -0.01 | 0.32 | 0.00 | .973 | 0.99 | 0.53~1.86 |
OR=odds ratio; CI=confidence interval; ER=emergency room;
†Dummy variable;
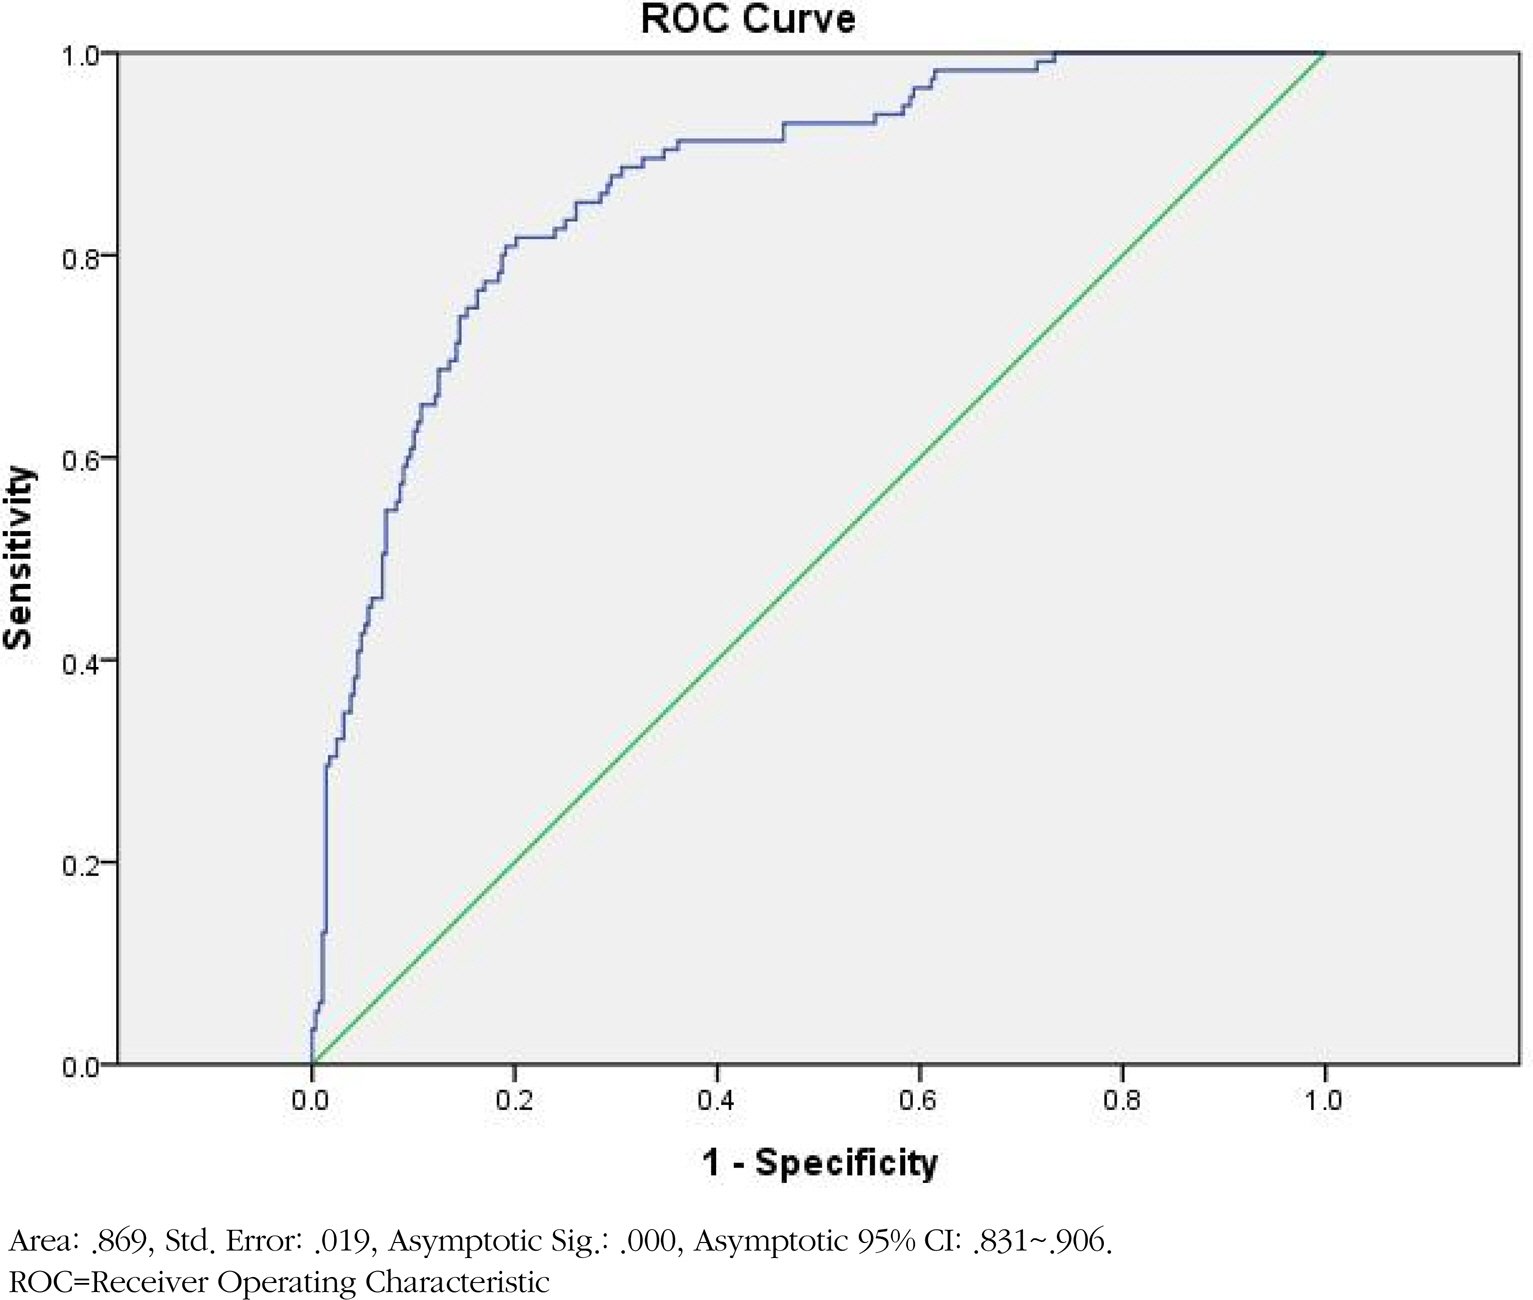
‡Reversed value. Model fit (H-L Statistics x2=1.99, df=8, p=.981); Model x2: 157.617 (df=14, p<.001); Model contains constant only: -2LL=481.94; Model contains independent variable: -2LL=324.33, Nagelkerke R2=.46.
ER=Emergency room; Multiple response.
ER=emergency room; No respondent excluded; Internal (Internal medicine, Neurology); Surgical (General surgery, Neurosurgery, Orthopedic surgery, Plastic surgery); Others (Ophthalmology, Obstetrics, etc.).
ER=emergency room.
OR=odds ratio; CI=confidence interval; ER=emergency room; Dummy variable; Reversed value. Model fit (H-L Statistics
 E-SUBMISSION