
PURPOSE
The purpose of the study was to validate fall risk assessment scales among hospitalized adult patients in South Korea using the electronic medical records by comparing sensitivity, specificity, positive predictive values, and negative predictive values of Morse Fall Scale (MFS), Bobath Memorial Hospital Fall Risk Assessment Scale (BMFRAS), and Johns Hopkins Hospital Fall Risk Assessment tool (JHFRAT).
METHODS
A total of 120 patients who experienced fall episodes during their hospitalization from June 2010 to December 2013 was categorized into the fall group. Another 120 patients, who didn't experience fall episodes with age, sex, clinical departments, and the type of wards matched with the fall group, were categorized to the comparison group. Data were analyzed for the comparisons of sensitivity, specificity, positive and negative predictive values, and the area under the curve of the three tools.
RESULTS
MFS at a cut-off score of 48 had .806 for ROC curves, 76.7% for sensitivity, 77.5% for specificity, 77.3% for positive predictive value, and 76.9% for negative predictive value, which were the highest values among the three fall assessment scales.
CONCLUSION
The MFS with the highest score and the highest discrimination was evaluated to be suitable and reasonable for predicting falls of inpatients in med-surg units of university hospitals.
The purpose of the study was to validate fall risk assessment scales among hospitalized adult patients in South Korea using the electronic medical records by comparing sensitivity, specificity, positive predictive values, and negative predictive values of Morse Fall Scale (MFS), Bobath Memorial Hospital Fall Risk Assessment Scale (BMFRAS), and Johns Hopkins Hospital Fall Risk Assessment tool (JHFRAT).
A total of 120 patients who experienced fall episodes during their hospitalization from June 2010 to December 2013 was categorized into the fall group. Another 120 patients, who didn't experience fall episodes with age, sex, clinical departments, and the type of wards matched with the fall group, were categorized to the comparison group. Data were analyzed for the comparisons of sensitivity, specificity, positive and negative predictive values, and the area under the curve of the three tools.
MFS at a cut-off score of 48 had .806 for ROC curves, 76.7% for sensitivity, 77.5% for specificity, 77.3% for positive predictive value, and 76.9% for negative predictive value, which were the highest values among the three fall assessment scales.
The MFS with the highest score and the highest discrimination was evaluated to be suitable and reasonable for predicting falls of inpatients in med-surg units of university hospitals.
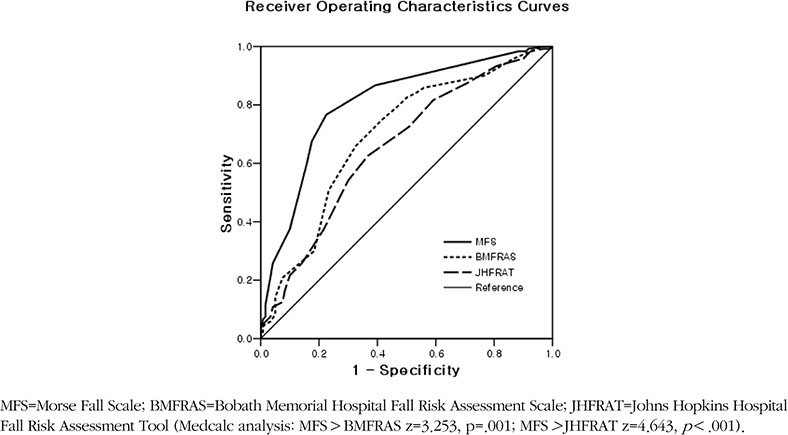
Figure 1
Receiver operating characteristics curves of the three fall risk assessment scales.
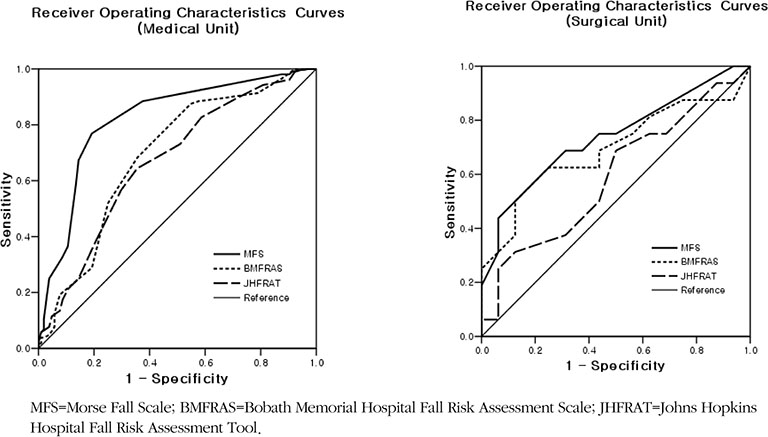
Figure 2
Receiver operating characteristics curves of the three fall risk assessment scales for participants from the medical or surgical units.
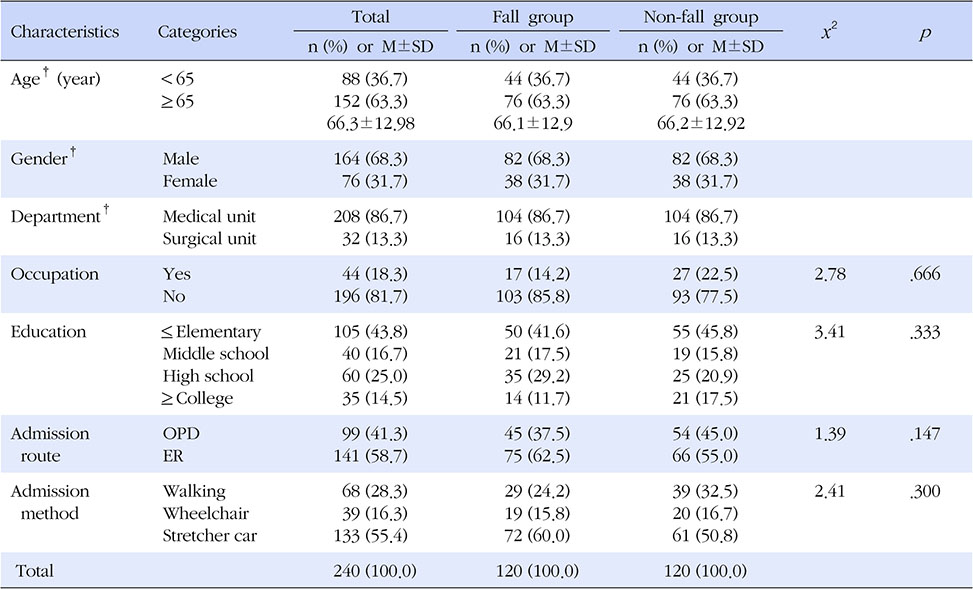
Table 1
Comparison of General Characteristics and Homogeneity Tests between the Fall and Non-fall Groups (N=240)
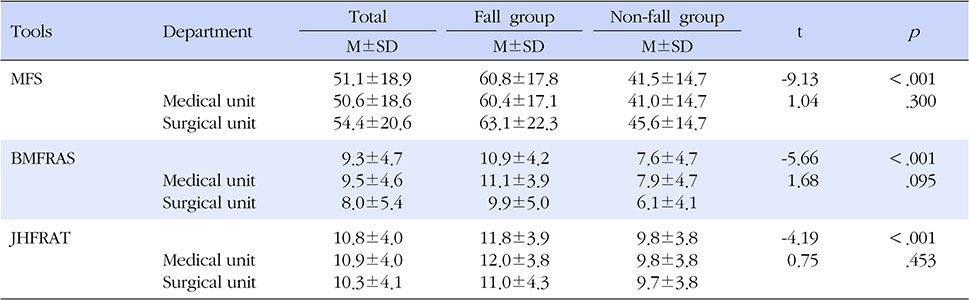
Table 2
Mean Scores of Fall Risk Assessment Scales by Department (N=240)
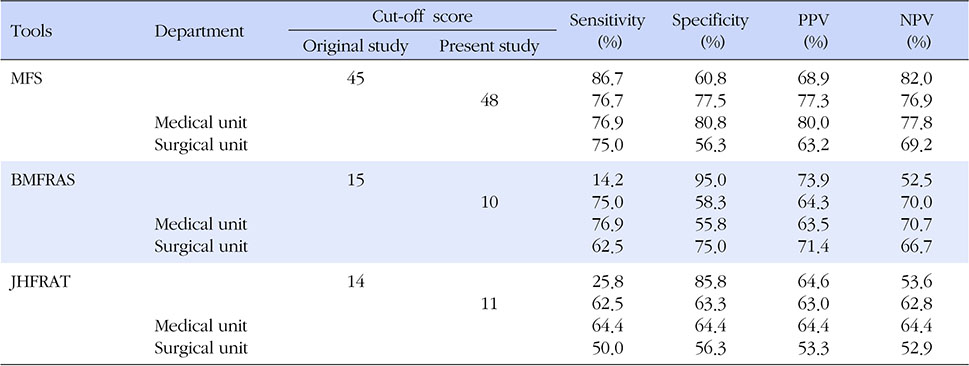
Table 3
Sensitivity, Specificity, PPV and NPV by Scales at each Cut-off Score by Department
This manuscript is a condensed form of the first author's doctoral dissertation from Chungnam National University.
 E-SUBMISSION