1Department of Nursing, Cheongju University, Cheongju
2Division of Nursing, Ewha Womans University, Seoul, Korea
Copyright © 2015 Korean Society of Adult Nursing
This is an Open Access article distributed under the terms of the Creative Commons Attribution Non-Commercial License (http://creativecommons.org/licenses/by-nc/3.0) which permits unrestricted non-commercial use, distribution, and reproduction in any medium, provided the original work is properly cited.
| Endogenous variables | Exogenous variables | β | t | p | SMC | Standardized direct effect (p) | Standardized indirect effect (p) | Standardized total effect (p) |
|---|---|---|---|---|---|---|---|---|
| Comorbidity | Age | .14 | 2.19 | .029 | .02 | .14 (.095) | .14 (.095) | |
| Physical activity | Age | -.20 | -3.06 | .002 | .09 | -.20 (.046) | -.03 (.041) | -.23 (.030) |
| Comorbidity | -.19 | -4.18 | <.001 | -.19 (.025) | -.19 (.025) | |||
| Social network | Comorbidity | -.16 | -3.23 | .001 | .10 | -.16 (.169) | -.05 (.012) | -.21 (.085) |
| Physical activity | .23 | 4.21 | <.001 | .23 (.017) | .23 (.017) | |||
| Loneliness | Social network | -.66 | -13.30 | <.001 | .43 | -.66 (.034) | -.66 (.034) | |
| Sleep hygiene† | Comorbidity | -.23 | -3.70 | <.001 | .22 | -.23 (.014) | -.02 (.526) | -.25 (.009) |
| Physical activity | .31 | 6.08 | <.001 | .31 (.016) | -.05 (.016) | .26 (.038) | ||
| Social network | -.39 | -4.36 | <.001 | -.39 (.023) | .19 (.099) | -.20 (.063) | ||
| Loneliness | -.29 | -4.16 | <.001 | -.29 (.077) | -.29 (.077) | |||
| Sleep duration | Physical activity | -.12 | -2.80 | .005 | .01 | -.12 (.440) | -.12 (.440) | |
| Sleep quality† | Physical activity | .20 | 3.85 | <.001 | .21 | .20 (.013) | .07 (.141) | .27 (.005) |
| Loneliness | -.31 | -5.50 | <.001 | -.31 (.015) | -.04 (.298) | -.35 (.013) | ||
| Sleep hygiene | .15 | 2.29 | .022 | .15 (.342) | .15 (.342) | |||
| Sleep duration | .14 | 2.39 | .017 | .14 (.011) | .14 (.011) | |||
| Cognitive function | Age | -.14 | -2.24 | .025 | .24 | -.14 (.147) | -.06 (.031) | -.21 (.041) |
| Physical activity | .20 | 4.12 | <.001 | .20 (.072) | .05 (.106) | .25 (.038) | ||
| Social network | .31 | 4.28 | <.001 | .31 (.010) | .31 (.010) | |||
| Sleep duration | .21 | 3.16 | .002 | .21 (< .001) | .21 (< .001) | |||
| Depression | Social network | -.33 | -4.84 | <.001 | .42 | -.33 (.002) | -.22 (.045) | -.56 (.001) |
| Loneliness | .29 | 4.06 | <.001 | .29 (.072) | .06 (.056) | .35 (.025) | ||
| Sleep quality | -.17 | -2.98 | .003 | -.17 (.045) | -.17 (.045) |


Descriptive Statistics of the Observed Variables (N=203)
| Variables | Categories | M±SD | Range | Skewness | Kurtosis |
|---|---|---|---|---|---|
| Sleep | Sleep duration (minutes) | 405.10±86.64 | 171.67~685.33 | 0.36 | 0.47 |
| Sleep quality | 9.23±3.67 | 2~18 | 0.30 | -0.52 | |
| Influencing factors of sleep | Age (year) | 75.86±6.06 | 65~91 | 0.26 | -0.29 |
| Comorbidity | 1.05±0.96 | 0~5 | 0.87 | 0.95 | |
| Physical activity | 730.07±1,083.21 | 0~7,144 | 2.95 | 10.40 | |
| (MET-min per week) | |||||
| Social network | 10.61±6.28 | 0~26 | 0.20 | -0.92 | |
| Loneliness | 41.44±11.03 | 20~75 | 0.38 | -0.19 | |
| Sleep hygiene | 22.65±5.98 | 13~44 | 0.99 | 0.80 | |
| Adverse outcomes of changes in sleep | Cognitive function | 25.39±3.48 | 12~30 | -1.06 | 1.51 |
| Depression | 4.99±4.07 | 0~14 | 0.47 | -0.99 |
Comparison of Model Fit for the Modified Model to the Hypothetical Model
| Fit Index | x2 (p) | df | Normed x2 | SRMR | GFI | IFI | CFI | RMSEA |
|---|---|---|---|---|---|---|---|---|
| Modified model (final model) | 40.37 (.014) | 23 | 1.76 | .07 | .97 | .94 | .94 | .06 |
| Hypothetical model | 28.598 (.001) | 10 | 2.86 | .04 | .98 | .94 | .93 | .10 |
| Acceptable criteria | p .01 > | 2~3 < | .10 < | .90 > | .90 > | .90 > | .05: Excellent ≤ .05~.08: Good | |
| .08~.10: Moderate |
Df=degree of freedom; SRMR=standardized root mean square residual; GFI=goodness fit Index; IFI=incremental fit index; CFI=comparative fit index; RMSEA=root mean square error approximation.
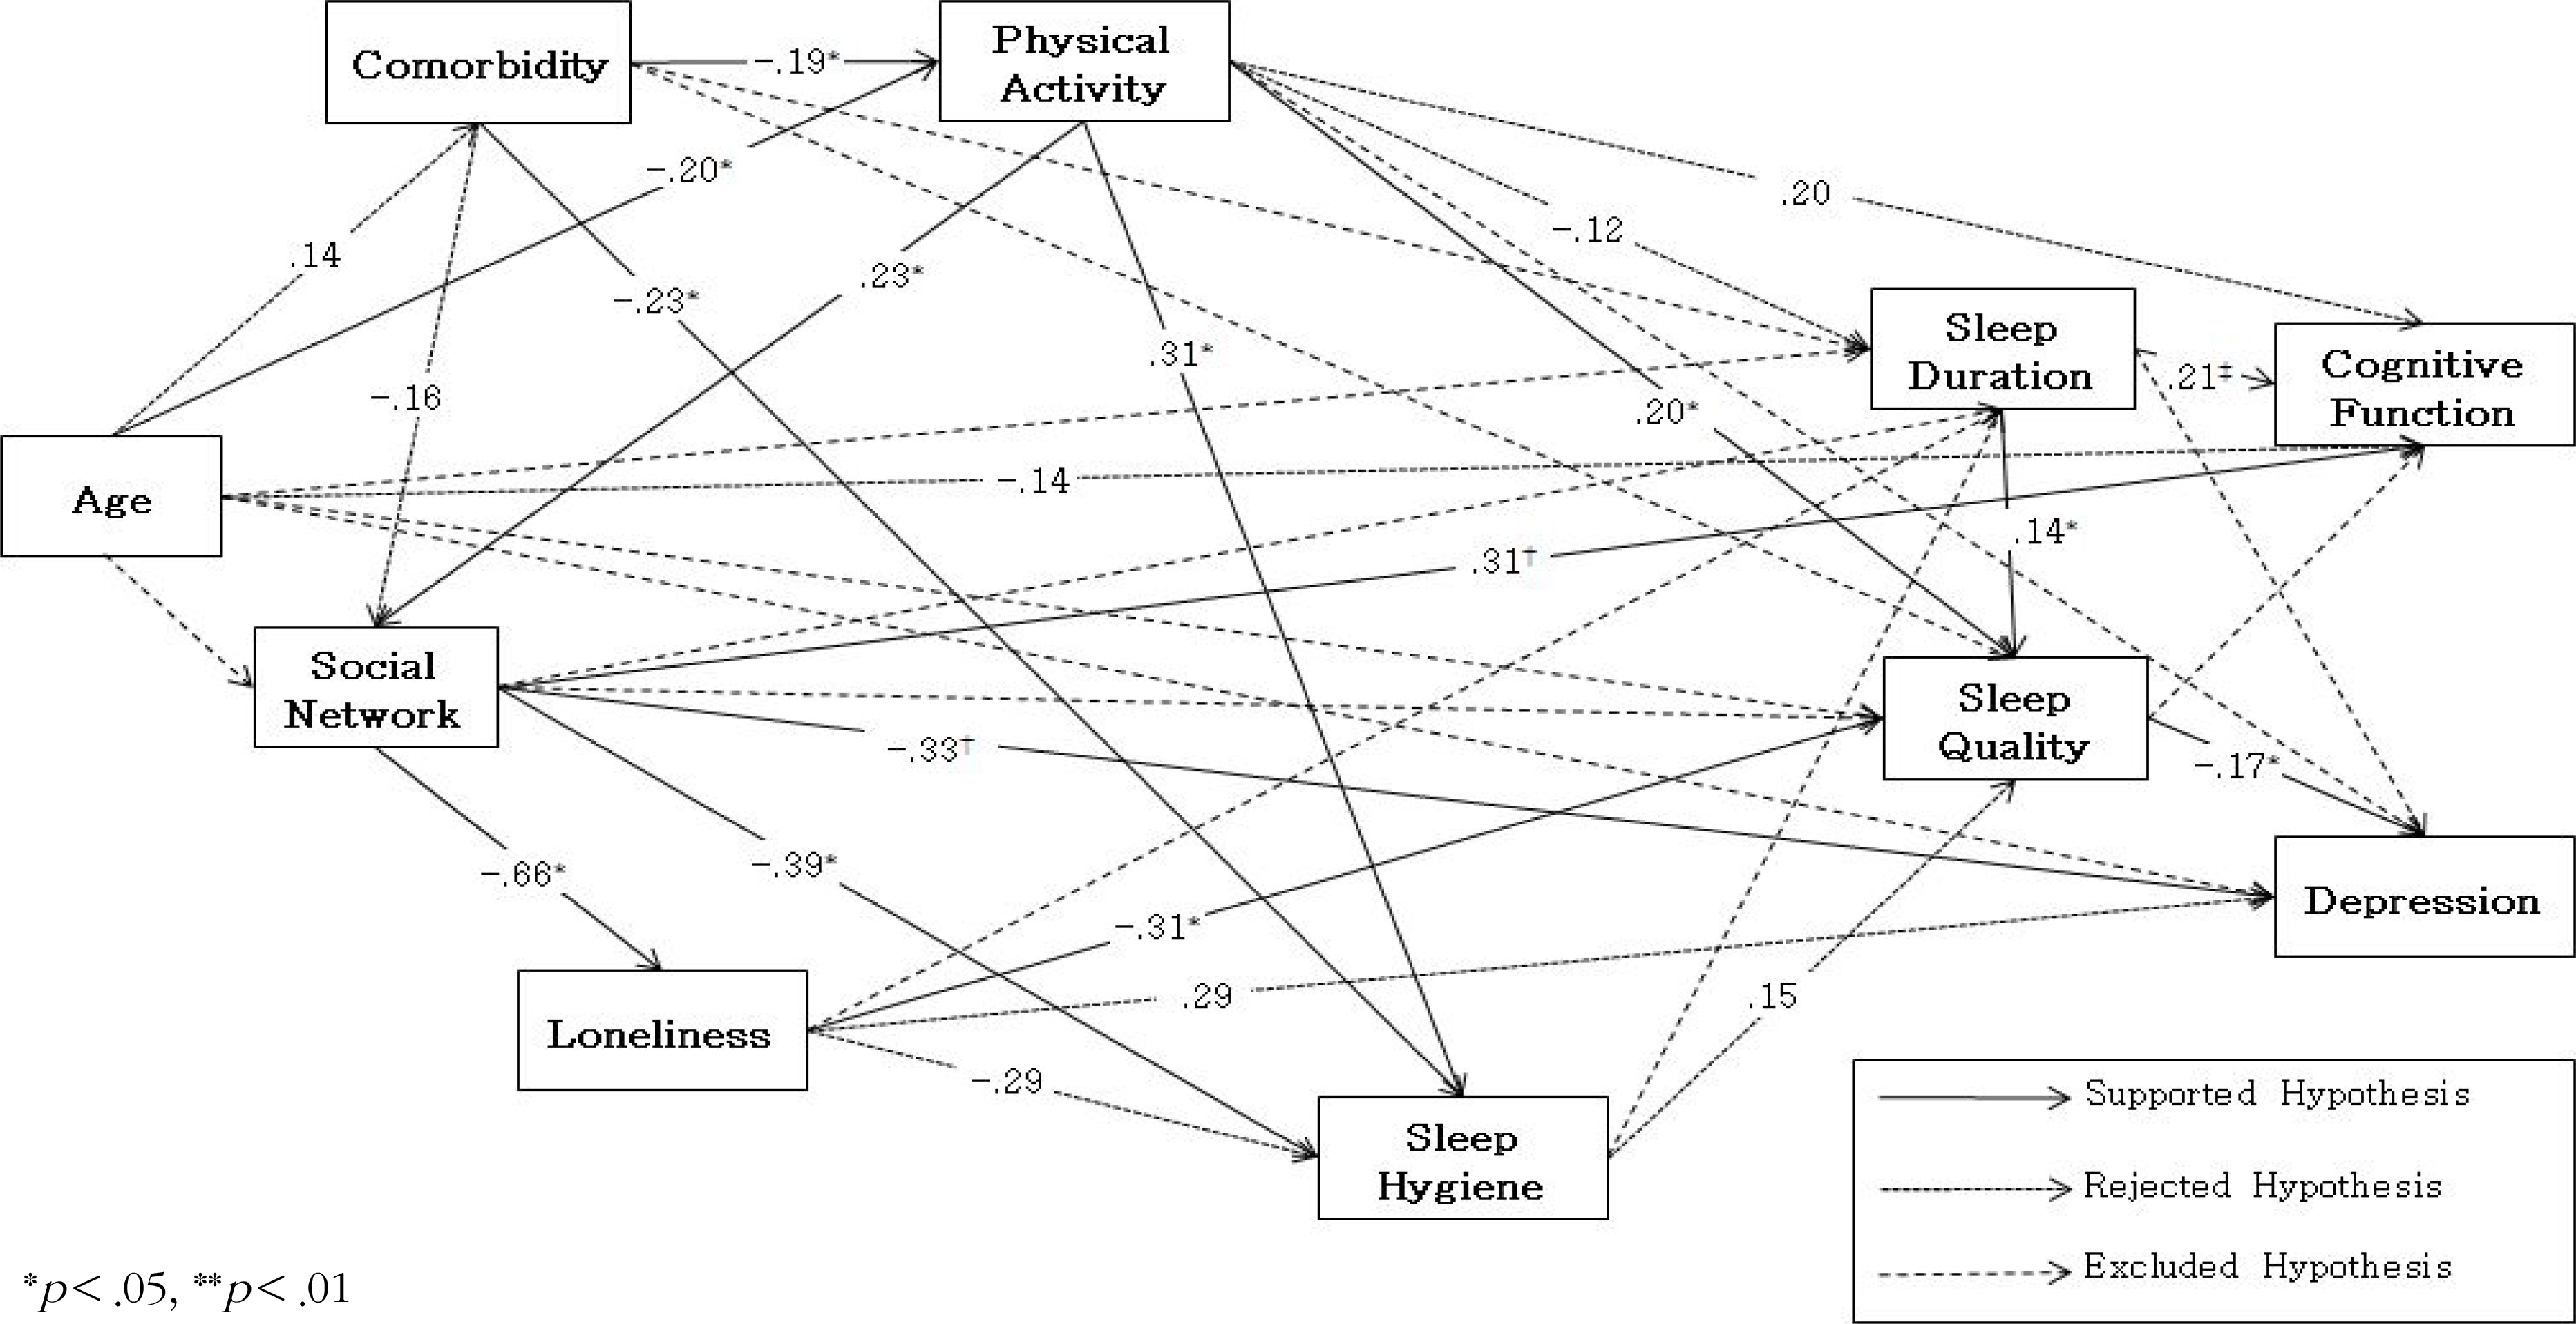
Path Coefficients and Standardized Direct, Indirect, and Total Effect for the Final Model (N=203)
| Endogenous variables | Exogenous variables | β | t | p | SMC | Standardized direct effect (p) | Standardized indirect effect (p) | Standardized total effect (p) |
|---|---|---|---|---|---|---|---|---|
| Comorbidity | Age | .14 | 2.19 | .029 | .02 | .14 (.095) | .14 (.095) | |
| Physical activity | Age | -.20 | -3.06 | .002 | .09 | -.20 (.046) | -.03 (.041) | -.23 (.030) |
| Comorbidity | -.19 | -4.18 | <.001 | -.19 (.025) | -.19 (.025) | |||
| Social network | Comorbidity | -.16 | -3.23 | .001 | .10 | -.16 (.169) | -.05 (.012) | -.21 (.085) |
| Physical activity | .23 | 4.21 | <.001 | .23 (.017) | .23 (.017) | |||
| Loneliness | Social network | -.66 | -13.30 | <.001 | .43 | -.66 (.034) | -.66 (.034) | |
| Sleep hygiene |
Comorbidity | -.23 | -3.70 | <.001 | .22 | -.23 (.014) | -.02 (.526) | -.25 (.009) |
| Physical activity | .31 | 6.08 | <.001 | .31 (.016) | -.05 (.016) | .26 (.038) | ||
| Social network | -.39 | -4.36 | <.001 | -.39 (.023) | .19 (.099) | -.20 (.063) | ||
| Loneliness | -.29 | -4.16 | <.001 | -.29 (.077) | -.29 (.077) | |||
| Sleep duration | Physical activity | -.12 | -2.80 | .005 | .01 | -.12 (.440) | -.12 (.440) | |
| Sleep quality |
Physical activity | .20 | 3.85 | <.001 | .21 | .20 (.013) | .07 (.141) | .27 (.005) |
| Loneliness | -.31 | -5.50 | <.001 | -.31 (.015) | -.04 (.298) | -.35 (.013) | ||
| Sleep hygiene | .15 | 2.29 | .022 | .15 (.342) | .15 (.342) | |||
| Sleep duration | .14 | 2.39 | .017 | .14 (.011) | .14 (.011) | |||
| Cognitive function | Age | -.14 | -2.24 | .025 | .24 | -.14 (.147) | -.06 (.031) | -.21 (.041) |
| Physical activity | .20 | 4.12 | <.001 | .20 (.072) | .05 (.106) | .25 (.038) | ||
| Social network | .31 | 4.28 | <.001 | .31 (.010) | .31 (.010) | |||
| Sleep duration | .21 | 3.16 | .002 | .21 (< .001) | .21 (< .001) | |||
| Depression | Social network | -.33 | -4.84 | <.001 | .42 | -.33 (.002) | -.22 (.045) | -.56 (.001) |
| Loneliness | .29 | 4.06 | <.001 | .29 (.072) | .06 (.056) | .35 (.025) | ||
| Sleep quality | -.17 | -2.98 | .003 | -.17 (.045) | -.17 (.045) |
x2=40.37 (df=23, p=.014), Normed x2=1.76, SRMR=.07, GFI=.97, IFI=.94, CFI=.94, RMSEA=.06; β=standardized regression weight; t=estimate for path coefficients; SMC=squared multiple correlation (R2);
†Reverse coded
Df=degree of freedom; SRMR=standardized root mean square residual; GFI=goodness fit Index; IFI=incremental fit index; CFI=comparative fit index; RMSEA=root mean square error approximation.
Reverse coded

