1Department of Nursing, Soonchunhyang University, Cheonan
2Department of Nursing, Korea National Open University, Seoul
3Department of Health Administration, Hanyang Cyber University, Seoul, Korea
Copyright © 2015 Korean Society of Adult Nursing
This is an Open Access article distributed under the terms of the Creative Commons Attribution Non-Commercial License (http://creativecommons.org/licenses/by-nc/3.0) which permits unrestricted non-commercial use, distribution, and reproduction in any medium, provided the original work is properly cited.


Characteristics of the Selected Studies
| YP | Authors | Location | Participants | As | FC | COP | Follow up | 2×2Table | Value (95% Confidence interval) | |||||||||
|---|---|---|---|---|---|---|---|---|---|---|---|---|---|---|---|---|---|---|
| Setting | Total (n) | M:F (n) | M±SD (year) | Aged criteria | TP | FP | FN | TN | SN | SP | DOR | |||||||
| 2013 | Kim et al.a1) | Korea | Neurology and rehabilitation wards | 1,026 | 484:542 | 56.4±14.9 | >20 | N | ≥1 | ≥2 | Until discharge | 27 | 263 | 5 | 731 | 0.84 (0.67~0.94) | 0.74 (0.73~0.74) | 15.0 (5.43~44.9) |
| 2011 | Barker et al.a2) | Australia | Medical and surgical wards | 263 | 137:126 | 61.3±20.6 | S | ≥1 | UR | Until discharge | 8 | 17 | 15 | 223 | 0.35 (0.18~0.54) | 0.93 (0.91~0.96) | 7.00 (2.33~20.9) | |
| 2011 | Marschollek et al.a3) | Germany | Geriatric inpatients | 50 (46) | 13:37 | 81.3 | S | ≥1 | ≥2 | Until discharge | 15 | 20 | 4 | 7 | 0.79 (0.62~0.92) | 0.26 (0.14~0.35) | 1.31 (0.27~6.65) | |
| 2008 | Vassallo et al.a4) | UK | Rehabilitation ward | 200 | 77:123 | 80.9 | C | ≥1 | ≥2 | Until discharge | 42 | 98 | 9 | 51 | 0.82 (0.71~0.91) | 0.34 (0.30~0.37) | 2.43 (1.04~5.84) | |
| 2008 | Webster et al.a5) | Australia | Medical and Surgical wards | 788 | 260:528 | 77.7±7.9 | >65 | N | ≥1 | ≥2 | Until discharge | 59 | 272 | 13 | 444 | 0.82 (0.71~0.90) | 0.62 (0.61~0.63) | 7.41 (3.86~14.47) |
| 2007 | Kim et al.a6) | Singapore | Medical and Surgical wards | 5,489 | 2,842:2,647 | 55.0±19.0 | >18 | N | ≥1 | ≥2 | Until first fall | 33 | 1,341 | 27 | 4,088 | 0.55 (0.42~0.68) | 0.75 (0.75~0.75) | 3.73 (2.17~6.41) |
| 2007 | Milisen et al.a7) | Belgium | Medical and Surgical wards | 2,568 | 1,148:1,420 | 67.2±18.4 | N | ≥1 | ≥2 | Until discharge | 122 | 997 | 14 | 1,435 | 0.90 (0.83~0.94) | 0.59 (0.59~0.59) | 12.54 (7.00~22.90) | |
| 2006 | Haines et al.a8) | Australia | Rehabilitation and aged care | 122 | 38:84 | 79.0±9.0 | S | ≥1 | ≥2 | Until discharge | 20 | 47 | 6 | 49 | 0.77 (0.58~0.90) | 0.51 (0.46~0.55) | 3.48 (1.18~10.68) | |
| 2006 | Smith et al.a9) | UK | Stroke rehabilitation units | 359 (225) | 176:183 | 78.0 (34~100) | S | ≥1 | ≥2 | 12 weeks after discharge | 6 | 18 | 47 | 154 | 0.11 (0.05~0.21) | 0.90 (0.88~0.92) | 1.09 (0.36~3.14) | |
| 2005 | Vassallo et al.a10) | UK | Medical wards | 135 | 49:86 | 83.8±8.0 | C | ≥1 | ≥2 | Until discharge | 15 | 38 | 7 | 75 | 0.68 (0.47~0.85) | 0.66 (0.62~0.70) | 4.23 (1.46~12.65) | |
| 2005 | Jester et al.a11) | UK | Hip fracture pts. in orthopaedic unit | 90 (60) | 20:70 | 60~81 | N | ≥1 | ≥2 | Unrepor ted | 1 | 14 | 1 | 44 | 0.50 (0.03~0.97) | 0.76 (0.74~0.78) ( | 3.14 (0.08~125.08) | |
| 2004 | Papaioannou et al.a12) | Canada | General medical units | 620 | 282:338 | 78.0±7.7 | >65 | N | ≥1 | ≥2 | Unrepor ted | 31 | 234 | 3 | 352 | 0.91 (0.75~0.98) | 0.60 (0.59~0.60) | 15.54 (4.48~64.53) |
| 2003 | Coker & Olivera13) | Canada | Geriatric unit with Parkinson's dz. etc. | 432 | 134:298 | 81.0 | N | ≥1 | ≥2 | Until discharge | 73 | 171 | 38 | 150 | 0.66 (0.57~0.74) | 0.47 (0.44~0.49) | 1.69 (1.05~2.71) | |
| 1997 | Oliver et al.a14) | UK | Elderly care and rehabilitation units | 837 | - | 80~83 | >65 | N | ≥1 | ≥2 | 8 weeks | 139 | 155 | 11 | 532 | 0.93 (0.87~0.96) | 0.77 (0.76~0.78) ( | 43.37 (22.17~87.00) |
YP=year of publication; M:F=male:female; As=assesser; FC=falls criteria; COP=cut off point; TP=true positive; FP=false positive; FN=false negative; TN=true negative; SN=sensitivity; SP=specificity; DOR=diagnosis odds ratio; N=nurses; S=staff members; C=clinicians; UR=unreported.
Summary Results of Meta-analysis
| Categories | Studies (n) | Results of pooled diagnostic test accuracy (95% Confidence interval) | Results of sROC curve | ||||||||||||
|---|---|---|---|---|---|---|---|---|---|---|---|---|---|---|---|
| Sensitivity | Specificity | Positive likelihood ratio | Negative likelihood ratio | Diagnostic odds ratio | AUC | SE (AUC) | Q* | SE (Q*) | |||||||
| I2 (%) | x2 | I2 (%) | x2 | ||||||||||||
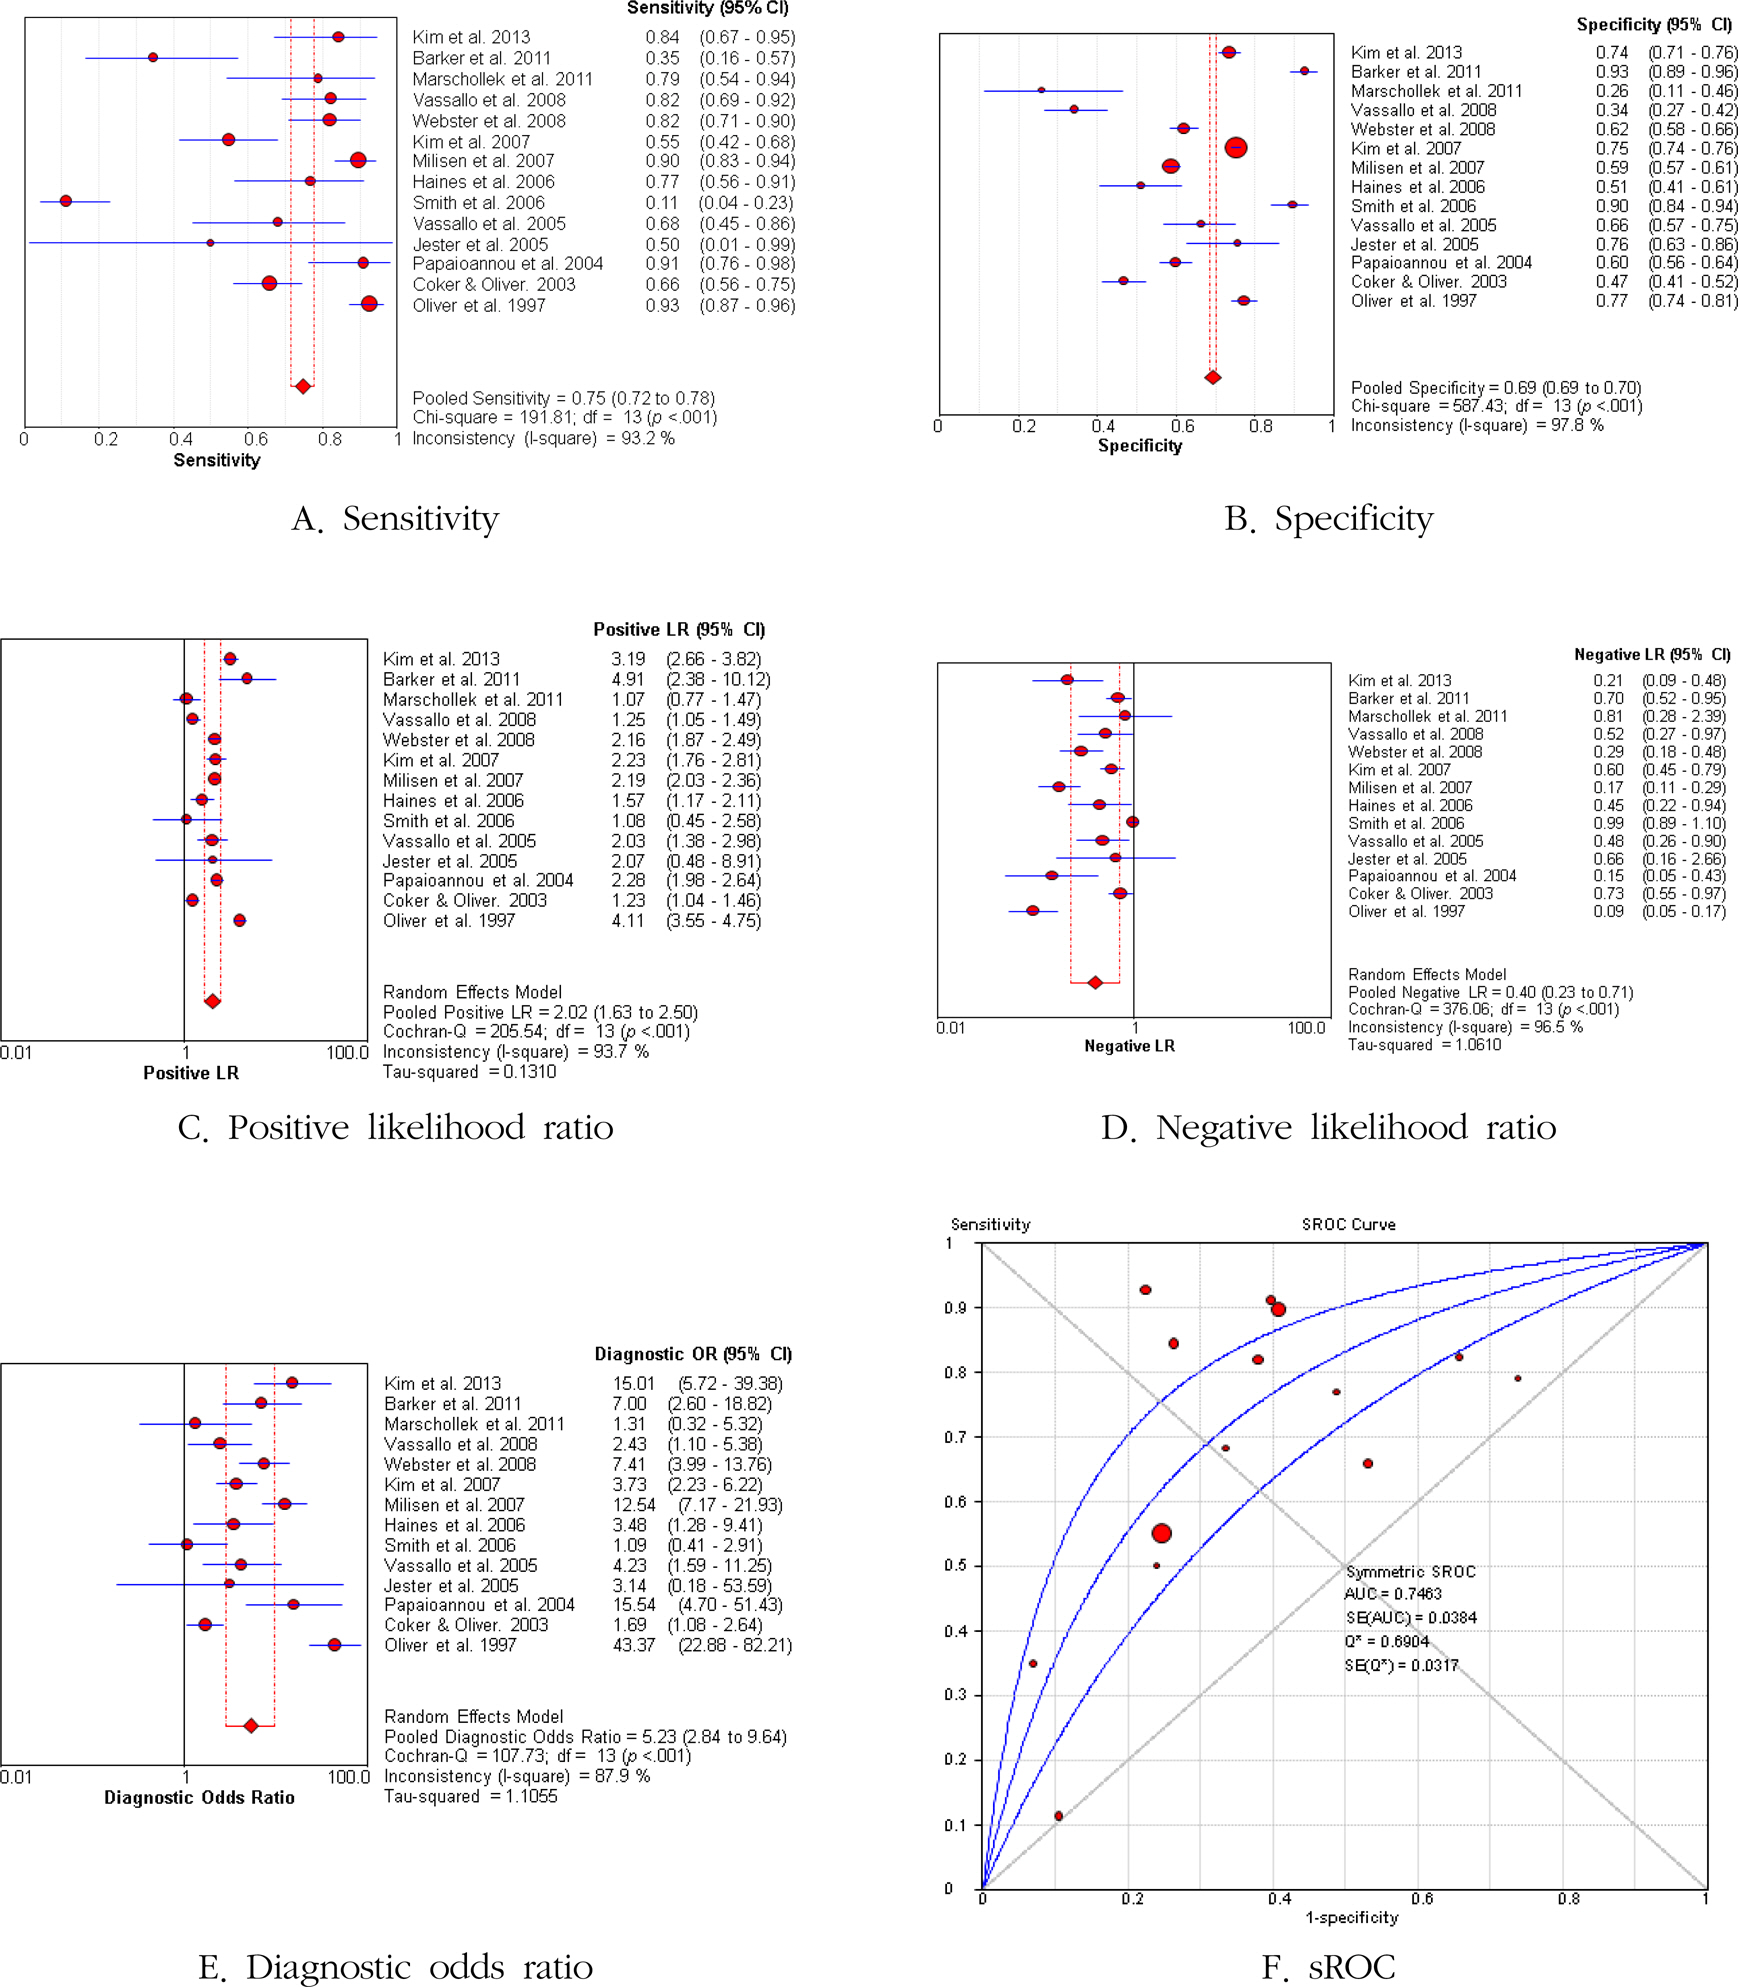
| Total | 14 | 0.75 (0.72~0.78) | 93.2 | 191.81** | 0.69 (0.69~0.70) | 97.8 | 587.43** | 2.02 (1.63~2.50) | 0.40 (0.23~0.71) | 5.23 (2.84~9.64) | 0.75 | 0.04 | 0.69 | 0.03 | |
| ≥65 elderly with G & RW | 3 | 0.80 (0.71~0.88) | 0.0 | 0.34 | 0.39 (0.33~0.45) | 78.2 | 9.19* | 1.28 (1.07~1.54) | 0.53 (0.34~0.82) | 2.47 (1.40~4.35) | 0.78 | 0.13 | 0.72 | 0.11 | |
| Setting | G & RW | 5 | 0.87 (0.83~0.91) | 55.0 | 8.89 | 0.70 (0.68~0.71) | 97.2 | 143.39** | 1.96 (0.12~3.40) | 0.32 (0.13~0.75) | 6.20 (1.58~24.41) | 0.94 | 0.06 | 0.88 | 0.08 |
| General wards | 6 | 0.77 (0.72~0.82) | 90.7 | 54.01** | 0.70 (0.69~0.70) | 98.5 | 331.48** | 2.21 (2.08~2.35) | 0.36 (0.21~0.63) | 7.09 (4.31~11.68) | 0.78 | 0.02 | 0.72 | 0.02 | |
| Specific disease pts. | 3 | 0.48 (0.40~0.56) | 95.7 | 47.05** | 0.63 (0.59~0.67) | 98.0 | 102.20** | 1.24 (1.05~1.46) | 0.85 (0.58~1.25) | 1.59 (1.06~2.37) | 0.58 | 0.03 | 0.56 | 0.03 | |
| Sex ratio | M<F (1<1.5) | 7 | 0.74 (0.69~0.79) | 36.9 | 9.50 | 0.55 (0.53~0.58) | 92.1 | 76.06** | 1.51 (1.18~1.93) | 0.52 (0.37~0.72) | 3.01 (1.73~5.26) | 0.71 | 0.06 | 0.66 | 0.05 |
| M≒F | 6 | 0.67 (0.62~0.72) | 96.4 | 140.00** | 0.71 (0.70~0.72) | 98.6 | 351.32** | 2.44 (2.05~2.91) | 0.38 (0.15~0.95) | 6.52 (3.00~14.17) | 0.80 | 0.03 | 0.73 | 0.02 | |
| Age (Average years) | >65 only | 3 | 0.89 (0.85~0.93) | 64.0 | 5.56 | 0.67 (0.65~0.69) | 96.5 | 56.35** | 2.72 (1.78~4.17) | 0.16 (0.07~0.37) 1 | 17.18 (5.02~58.75) | 0.81 | 0.30 | 0.75 | 0.27 |
| ≤60 | 4 | 0.76 (0.70~0.81) | 93.8 | 48.18** | 0.71 (0.70~0.72) | 98.9 | 284.46** | 2.65 (2.05~3.42) | 0.37 (0.17~0.78) | 8.10 (3.85~17.03) | 0.81 | 0.04 | 0.74 | 0.03 | |
| 70~79 | 4 | 0.63 (0.55~0.70) | 96.7 | 90.57** | 0.64 (0.61~0.66) | 95.8 | 70.66** | 1.98 (1.62~2.43) | 0.38 (0.07~2.08) | 4.52 (1.62~12.65) | 0.74 | 0.03 | 0.68 | 0.03 | |
| ≥80 | 5 | 0.80 (0.76~0.84) | 87.8 | 32.89** | 0.63 (0.60~0.65) | 97.6 | 67.63** | 1.69 (0.93~306) | 0.42 (0.16~1.08) | 4.08 (0.96~17.38) | 0.77 | 0.16 | 0.71 | 0.14 | |
| Assessor | Nurses | 8 | 0.81 (0.78~0.84) | 89.0 | 63.53** | 0.69 (0.68~0.70) | 98.0 | 353.14 | 2.34 (1.83~2.98) | 0.29 (0.15~0.54) | 8.47 (3.55~20.20) | 0.76 | 0.06 | 0.70 | 0.05 |
| Staff members | 4 | 0.40 (0.32~0.50) | 93.8 | 48.54** | 0.81 (0.77~0.84) | 97.5 | 119.24** | 1.66 (0.97~2.82) | 0.75 (0.48~1.16) | 2.53 (1.04~6.14) | 0.64 | 0.09 | 0.61 | 0.07 | |
| Age (≥65) & assesser | Nurses assessed | 4 | 0.90 (0.86~0.92) | 46.1 | 5.57 | 0.62 (0.61~0.64) | 96.5 | 84.59** | 2.57 (1.91~3.47) | 0.17 (0.10~0.28) 1 | 15.77 (7.02~35.43) | 0.85 | 0.19 | 0.78 | 0.17 |
| Staff members assesse | d 3 | 0.42 (0.32~0.52) | 95.8 | 48.15** | 0.71 (0.66~0.76) | 97.3 | 75.03** | 1.28 (0.95~1.72) | 0.74 (0.34~1.57) | 1.77 (0.83~3.79) | 0.60 | 0.07 | 0.58 | 0.05 | |
| Research Scale | ≥500 | 6 | 0.85 (0.81~0.88) | 88.4 | 43.14** | 0.70 (0.69~0.71) | 98.2 | 279.69** | 2.61 (2.09~3.26) | 0.22 (0.10~0.45) 1 | 12.03 (5.55~26.10) | 0.79 | 0.05 | 0.73 | 0.04 |
| <500 | 8 | 0.59 (0.53~0.64) | 91.4 | 81.11** | 0.64 (0.61~0.67) | 97.6 | 290.88** | 1.48 (1.19~1.84) | 0.67 (0.49~0.93) | 2.46 (1.59~3.80) | 0.65 | 0.04 | 0.61 | 0.03 | |
ROC curve=receiver operating characteristic curve; AUC=area under the curve; SE=standard error; G & RW=Geriatric and rehabilitation wards; M=male; F=female; *p<.01; **p<.001.
YP=year of publication; M:F=male:female; As=assesser; FC=falls criteria; COP=cut off point; TP=true positive; FP=false positive; FN=false negative; TN=true negative; SN=sensitivity; SP=specificity; DOR=diagnosis odds ratio; N=nurses; S=staff members; C=clinicians; UR=unreported.
ROC curve=receiver operating characteristic curve; AUC=area under the curve; SE=standard error; G & RW=Geriatric and rehabilitation wards; M=male; F=female; *p<.01; **p<.001.

