1Chonnam National University Hwasun Hospital, Hwasun
2Department of Nursing, Honam University, Gwangju
3College of Nursing, Chonnam National University · CRINS, Gwangju, Korea
Copyright © 2016 Korean Society of Adult Nursing
This is an Open Access article distributed under the terms of the Creative Commons Attribution Non-Commercial License (http://creativecommons.org/licenses/by-nc/3.0) which permits unrestricted non-commercial use, distribution, and reproduction in any medium, provided the original work is properly cited.
| Model | df | x2 (p) | TLI | CFI | RMSEA | SRMR |
|---|---|---|---|---|---|---|
| Criterion | ≥.00 | Low (≥.05) | ≥.90 | ≥.90 | ≤.08 | ≤.08 |
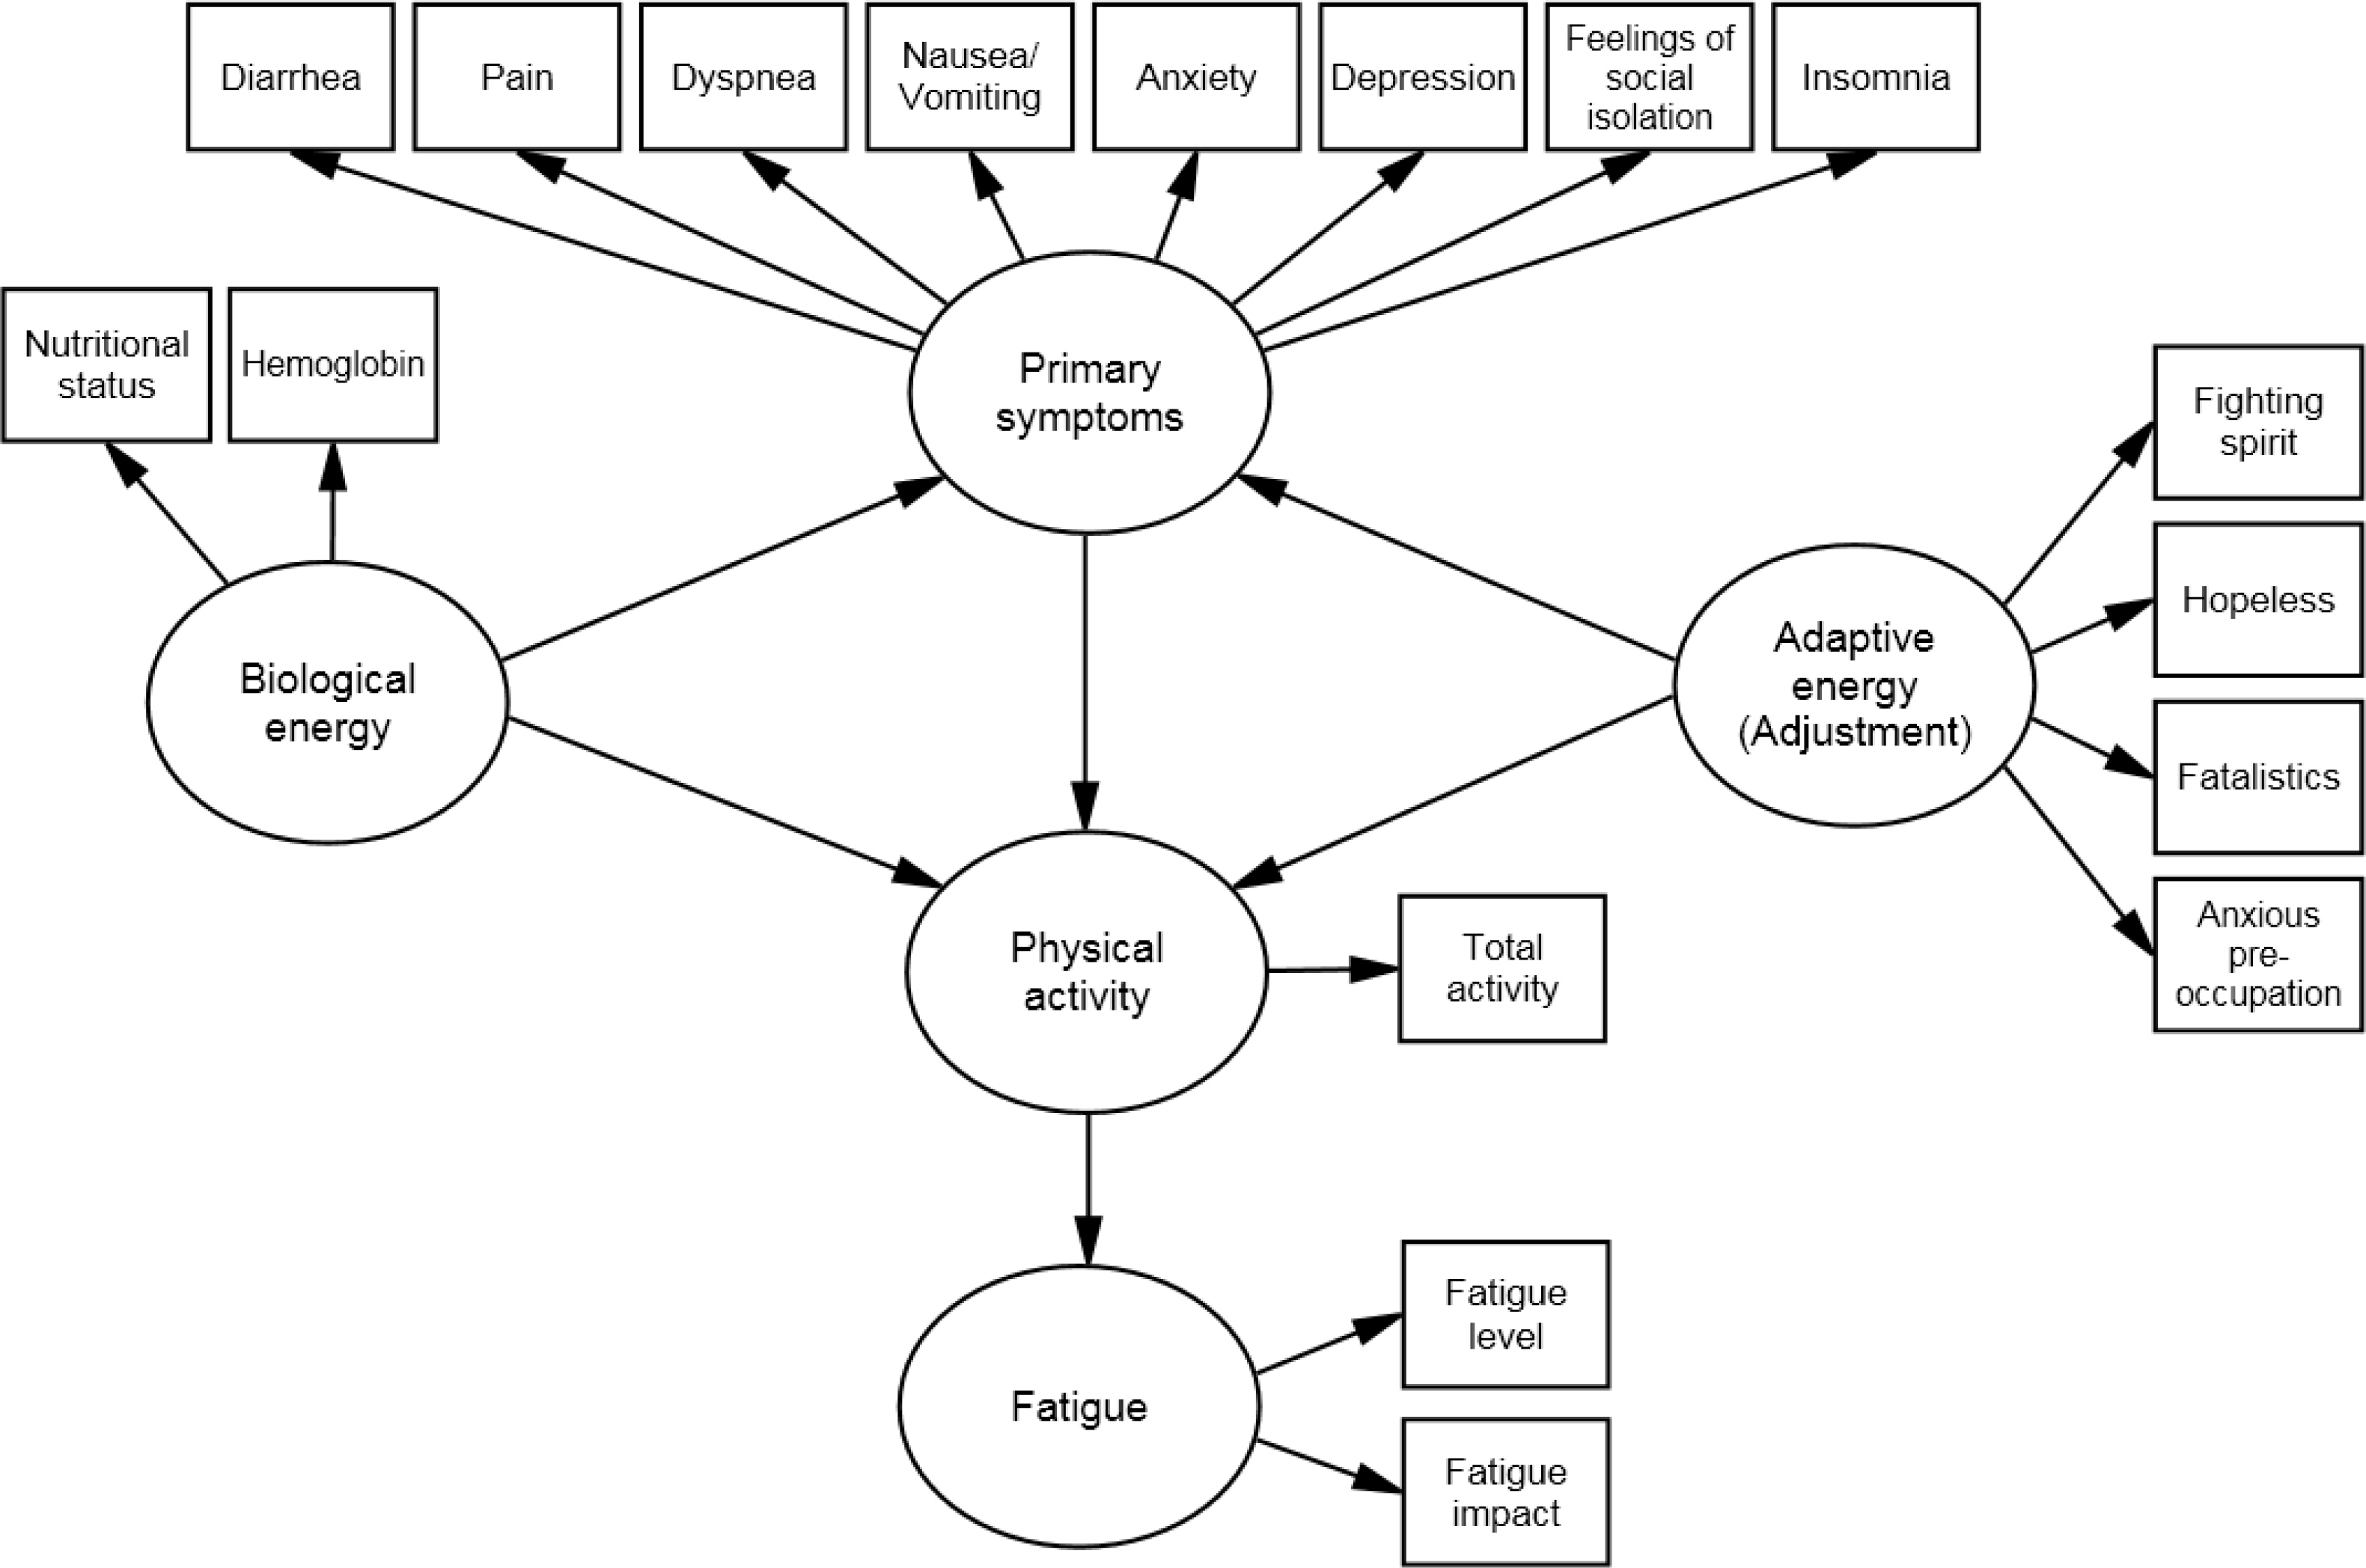
| Hypothetical model | 31 | 164.18 (<.001) | .71 | .80 | .15 | .16 |
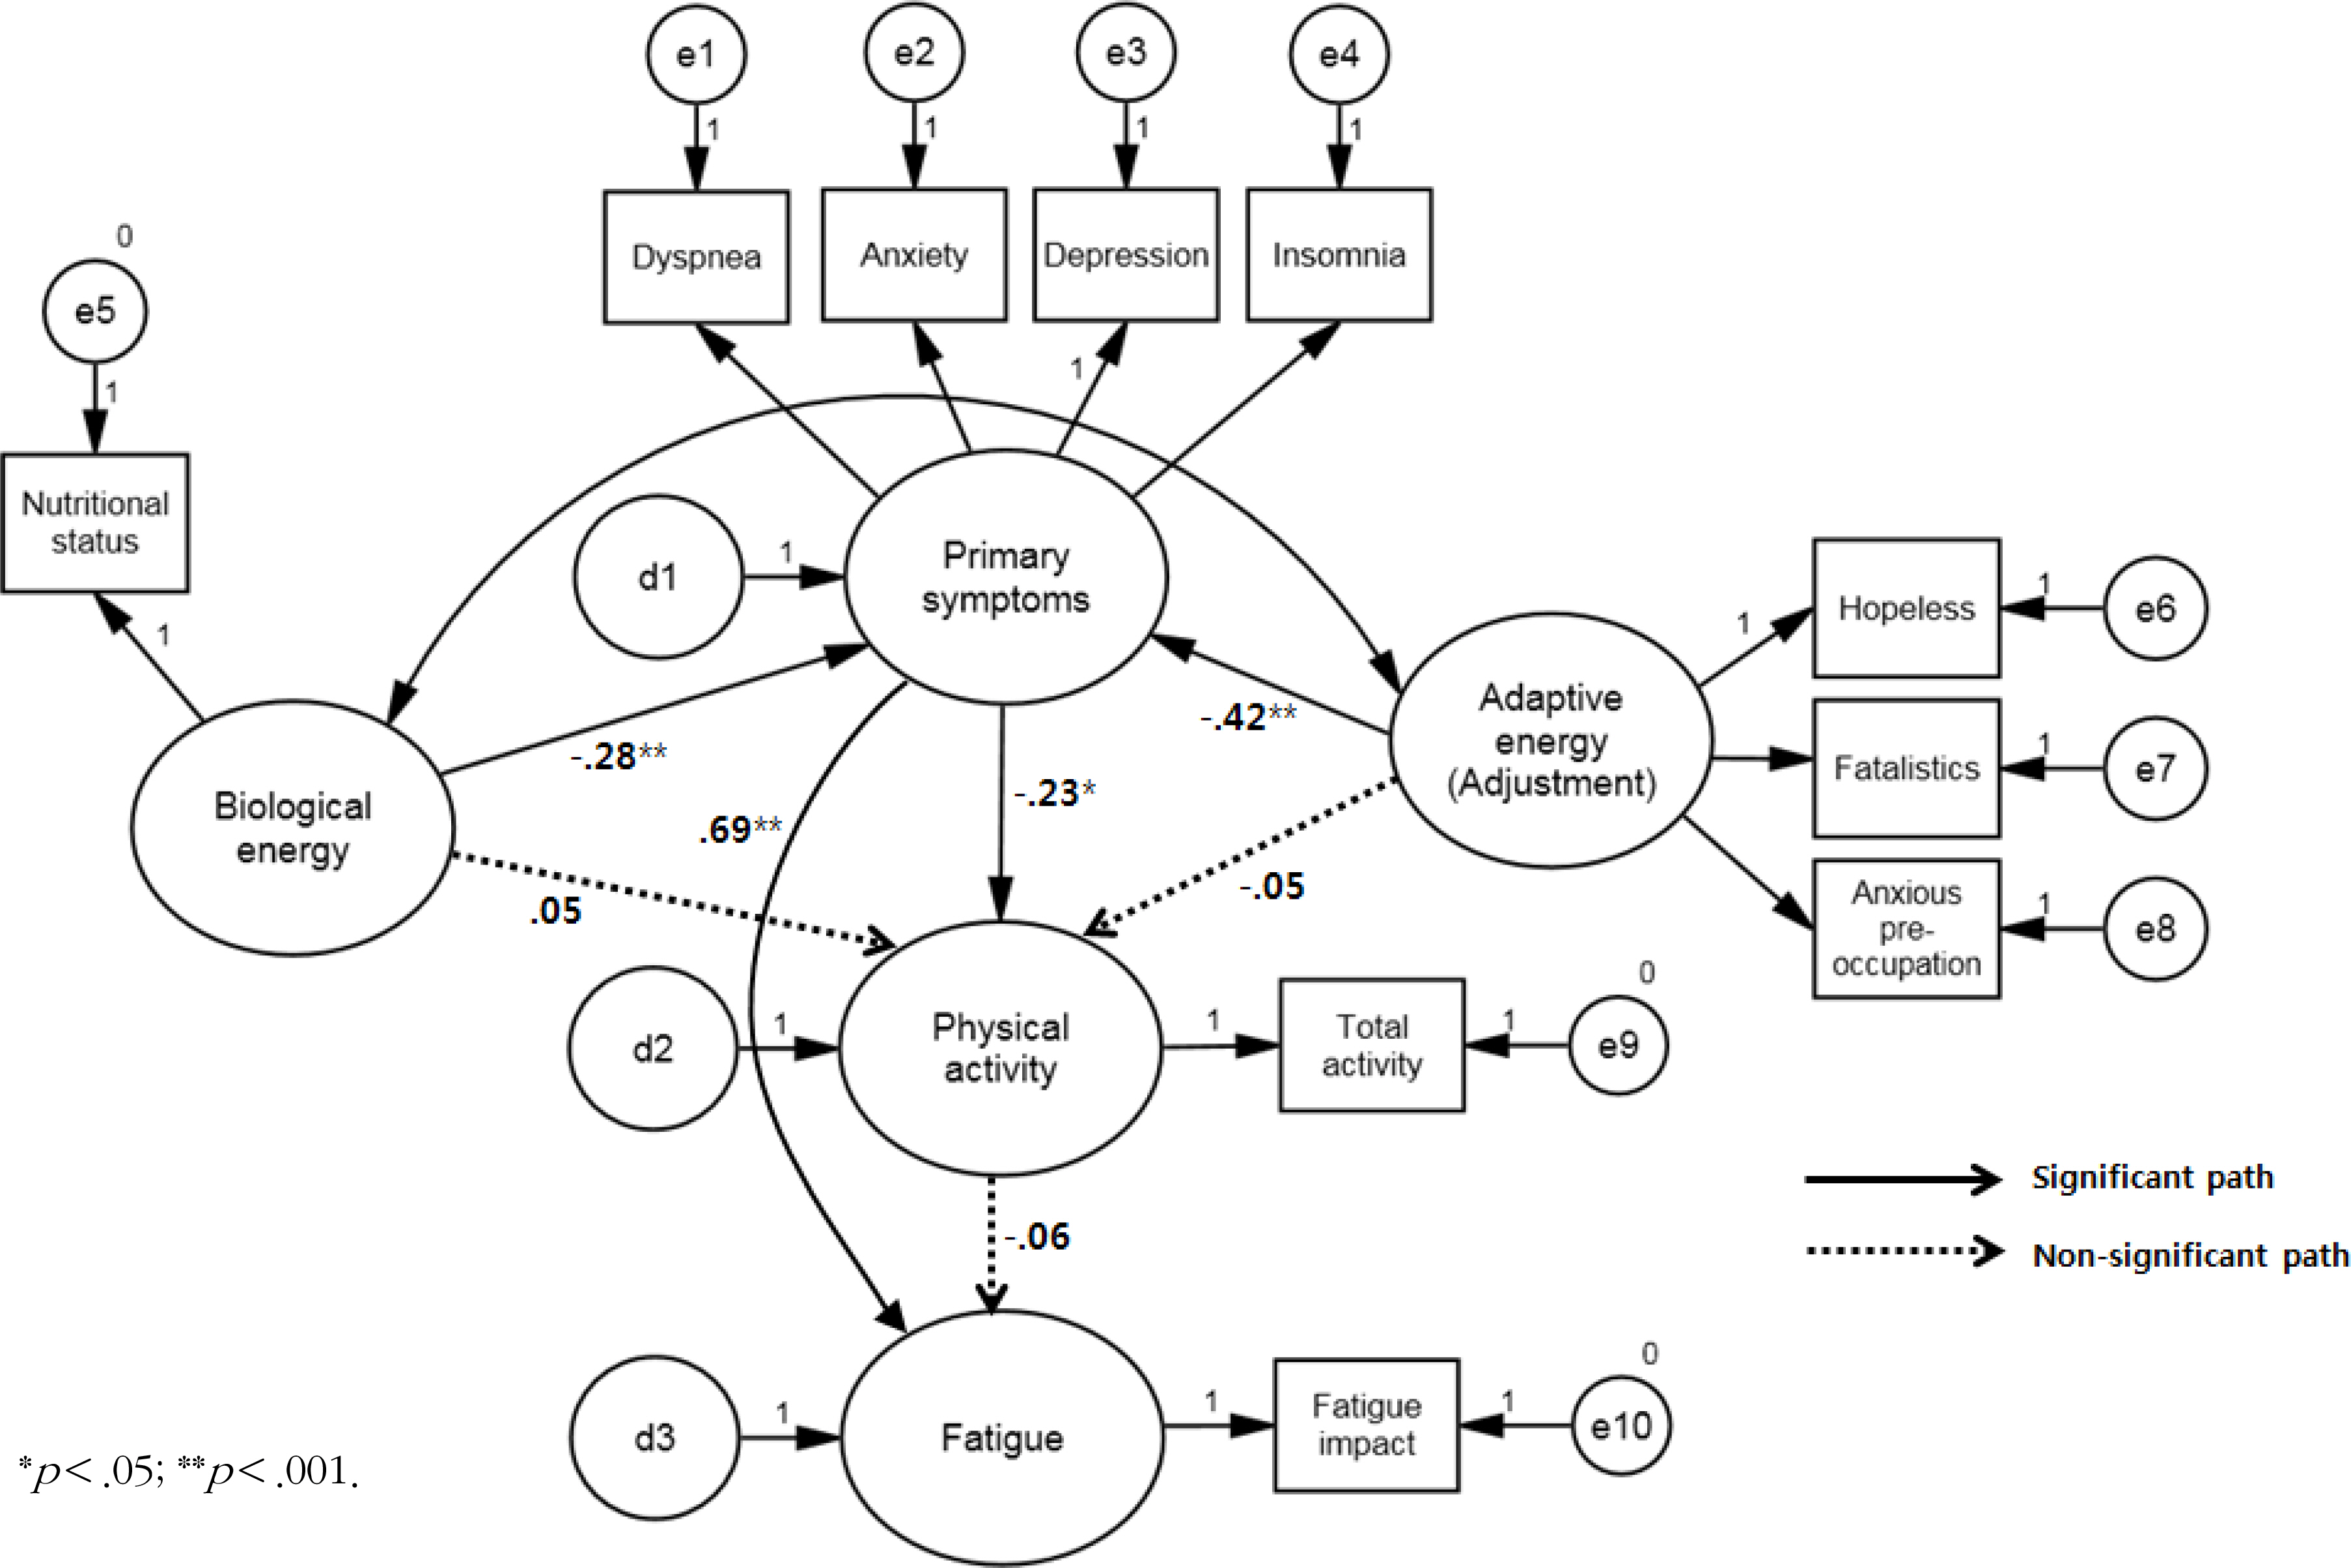
| Modified model | 30 | 65.80 (<.001) | .92 | .95 | .08 | .07 |


Descriptive Statistics of the Observed Variables (N=202)
| Variables | Range | M±SD | Skewness | Kurtosis |
|---|---|---|---|---|
| Diarrhea | - | 0.63±1.52 | 2.88 | 8.25 |
| Pain | 0~10 | 1.86±2.62 | 1.20 | 0.17 |
| Dyspnea | 1~5 | 0.43±1.07 | 2.51 | 5.52 |
| Nausea/vomiting | 0~4 | 0.33±0.63 | 2.51 | 6.71 |
| Anxiety | 0~3 | 0.71±0.57 | 0.74 | -0.06 |
| Depression | 0~3 | 1.01±0.63 | 0.41 | -0.50 |
| Feelings of social isolation | 1~5 | 2.42±0.72 | 0.26 | -0.24 |
| Insomnia | 0~4 | 1.06±0.90 | 0.94 | 0.17 |
| Nutritional status | 1~4 | 1.96±0.99 | 0.86 | 0.46 |
| Hemoglobin | - | 11.64±1.63 | -0.26 | 0.00 |
| Adjustment | 1~4 | 2.75±0.47 | -0.42 | -0.22 |
| Fighting spirit | 1~4 | 2.34±0.51 | -0.74 | 0.91 |
| Hopeless | 1~4 | 2.66±0.69 | -0.31 | -0.26 |
| Fatalistics | 1~4 | 2.36±0.76 | -0.18 | -0.72 |
| Anxious preoccupation | 1~4 | 2.57±0.65 | -0.30 | -0.01 |
| Physical activity | 1~3 | 1.59±0.63 | 0.61 | -0.58 |
| Fatigue | 0~10 | 3.34±2.39 | 0.44 | -0.78 |
| Fatigue level | 0~10 | 4.00±2.54 | 0.13 | -1.01 |
| Fatigue impact | 0~10 | 3.01±2.59 | 0.56 | -0.77 |
Goodness of Model Fit Indices (N=202)
| Model | df | x2 (p) | TLI | CFI | RMSEA | SRMR |
|---|---|---|---|---|---|---|
| Criterion | ≥.00 | Low (≥.05) | ≥.90 | ≥.90 | ≤.08 | ≤.08 |
| Hypothetical model | 31 | 164.18 (<.001) | .71 | .80 | .15 | .16 |
| Modified model | 30 | 65.80 (<.001) | .92 | .95 | .08 | .07 |
TLI=Tuker-Lewis index; CFI=comparative fit index; RMSEA=root mean square error of approximation; SRMR=standardized root mean square residual.
Effects of Predictive Variables in the Modified Model (N=202)
| Endogenous variables | Exogenous variables | β (p) | SE | CR (t-value) | SMC | SDE (p) | SIE (p) | STE (p) |
|---|---|---|---|---|---|---|---|---|
| Primary symptoms | Biological energy | -.28 (<.001) | ) .04 | -4.02 | .311 | -.28 (.001) | - | -.28 (.001) |
| Adaptive energy | -.42 (<.001) | ) .06 | -5.35 | -.42 (.003) | - | -.42 (.003) | ||
| Physical activity | Biological energy | .05 (.511) | .05 | 0.66 | .053 | .05 (.511) | .06 (.005) | .11 (.144) |
| Adaptive energy | -.05 (.595) | .08 | -0.53 | -.05 (.587) | .09 (.010) | .05 (.559) | ||
| Primary symptoms | -.23 (.019) | .12 | -2.34 | -.23 (.012) | - | -.23 (.012) | ||
| Fatigue | Biological energy | - | - | - | .490 | - | -.20 (.001) | -.20 (.001) |
| Adaptive energy | - | - | - | - | -.29 (.003) | -.29 (.003) | ||
| Primary symptoms | .69 (<.001) | ) .34 | 9.85 | .69 (.003) | .01 (.165) | .70 (.003) | ||
| Physical activity | -.06 (.313) | .23 | -1.01 | -.06 (.261) | - | -.06 (.261) |
β=standardized regression weights; SE=standard errors; CR=critical ratios; SMC=squared multiple correlations; SDE=standardized direct effects; SIE=standardized indirect effects; STE=standardized total effects.
TLI=Tuker-Lewis index; CFI=comparative fit index; RMSEA=root mean square error of approximation; SRMR=standardized root mean square residual.
β=standardized regression weights; SE=standard errors; CR=critical ratios; SMC=squared multiple correlations; SDE=standardized direct effects; SIE=standardized indirect effects; STE=standardized total effects.