Division of Nursing ‧ Research Institute of Nursing Science, Hallym University, Chuncheon, Korea
© 2013 Korean Society of Adult Nursing
This is an Open Access article distributed under the terms of the Creative Commons Attribution Non-Commercial License (http://creativecommons.org/licenses/by-nc/3.0/) which permits unrestricted non-commercial use, distribution, and reproduction in any medium, provided the original work is properly cited.
| Variables | Categories | Early nutrition (n=23) | Delayed nutrition (n=22) | Between group | Within group | |
|---|---|---|---|---|---|---|
| Group | Time | Time×Group | ||||
| M±SD (kcal) | M±SD (kcal) | F (p)† | F (p)† | F (p)† | ||
| Energy received (total) | Day1 | 714±236 | 1,203±422 | 13.89 (.001) | 0.90 (.455) | 5.59 (.004) |
| Day2 | 921±282 | 1,122±402 | ||||
| Day3 | 1,132±189 | 1,136±243 | ||||
| Day4 | 1,075±263 | 1,160±242 | ||||
| Mean | 958±161 | 1,165±189 | ||||
| Energy received (enteral) | Day1 | 548±124 | 893±201 | 4.54 (.041) | 1.71 (.187) | 2.60 (.057) |
| Day2 | 854±234 | 1,003±259 | ||||
| Day3 | 1,103±177 | 1,071±236 | ||||
| Day4 | 1,075±263 | 1,116±237 | ||||
| Mean | 892±160 | 1,012±178 | ||||
| Energy required | 1,228±230 | 1,377±317 | ||||
| Variables | Early nutrition (n=23) | Delayed nutrition (n=22) | x2† | p |
|---|---|---|---|---|
| n (%) | n (%) | |||
| Underfeeding | 17 (73.9) | 11 (50.0) | 2.76 | .089 |
| Adequate feeding | 6 (26.1) | 11 (50.0) |

Characteristics of Participants (N=45)
| Characteristics | Categories | Early nutrition (n=23) | Delayed nutrition (n=22) | x2 or t | p |
|---|---|---|---|---|---|
| n (%) or M±SD | n (%) or M±SD | ||||
| Age(year) | 71.7±13.8 | 66.1±15.0 | 1.29 | .203 | |
| ≤54 | 2 (8.7) | 5 (22.7) | 2.74 | .601 | |
| 55~64 | 4 (17.4) | 3 (13.6) | |||
| 65~74 | 5 (21.7) | 6 (27.3) | |||
| 75~84 | 9 (39.1) | 7 (31.8) | |||
| ≥85 | 3 (13.1) | 1 (4.6) | |||
| Gender | Male | 9 (39.1) | 13 (59.1) | -0.20 | .189 |
| Female | 14 (60.9) | 9 (40.9) | |||
| Diagnosis | Gastrointestinal | 0 (0.0) | 2 (9.1) | -0.21 | .158 |
| Neurological | 13 (56.5) | 9 (40.9) | |||
| Sepsis | 1 (4.3) | 2 (9.1) | |||
| Renal | 3 (13.1) | 3 (13.6) | |||
| Respiratory | 6 (26.1) | 6 (27.3) | |||
| APACHE II score | 11.2±5.6 | 15.6±6.0 | -2.50 | .016 | |
| Serum albumin (mg) | 3.4±0.8 | 3.2±0.6 | -0.16 | .875 | |
| Serum CRP (mg) | 3.7±5.0 | 7.1±7.2 | -1.78 | .082 | |
| BMI | Underweight (<18.5) | 2 (8.7) | 2 (9.1) | -0.04 | .804 |
| Healthy weight (18.5~22.9) | 8 (34.8) | 8 (36.4) | |||
| Over weight (23~24.9) | 8 (34.8) | 6 (27.3) | |||
| Mild obese (25~25.9) | 5 (21.7) | 6 (27.3) | |||
| Feeding tube location | Nasogastric tube | 23 (100.0) | 22 (100.0) | - | - |
| Feeding tube size | 16 Fr | 12 (52.2) | 12 (54.5) | -0.02 | .877 |
| 18 Fr | 11 (47.8) | 10 (45.5) | |||
| Feeding formula | Isocaloric | 20 (87.0) | 15 (68.2) | 2.29 | .130 |
| Calorically dense | 3 (13.0) | 7 (31.8) | |||
| Prokinetics | No | 20 (87.0) | 17 (77.3) | 0.55 | .458 |
| Yes | 3 (13.0) | 5 (22.7) | |||
| Gastric residual | Low(<50) | 17 (73.9) | 14 (63.6) | 0.75 | .477 |
| High(≥50ml) | 6 (26.1) | 8 (36.4) | |||
| Diarrhea | No | 18 (78.2) | 12 (54.5) | 3.52 | .061 |
| Yes | 5 (21.8) | 10 (45.5) | |||
| Vomiting | No | 22 (95.6) | 20 (90.9) | 1.89 | .169 |
| Yes | 1 (4.4) | 2 (9.1) |
APACHE II=acute physiology chronic health evaluation II; CRP=C-reactive protein; BMI=body mass index.
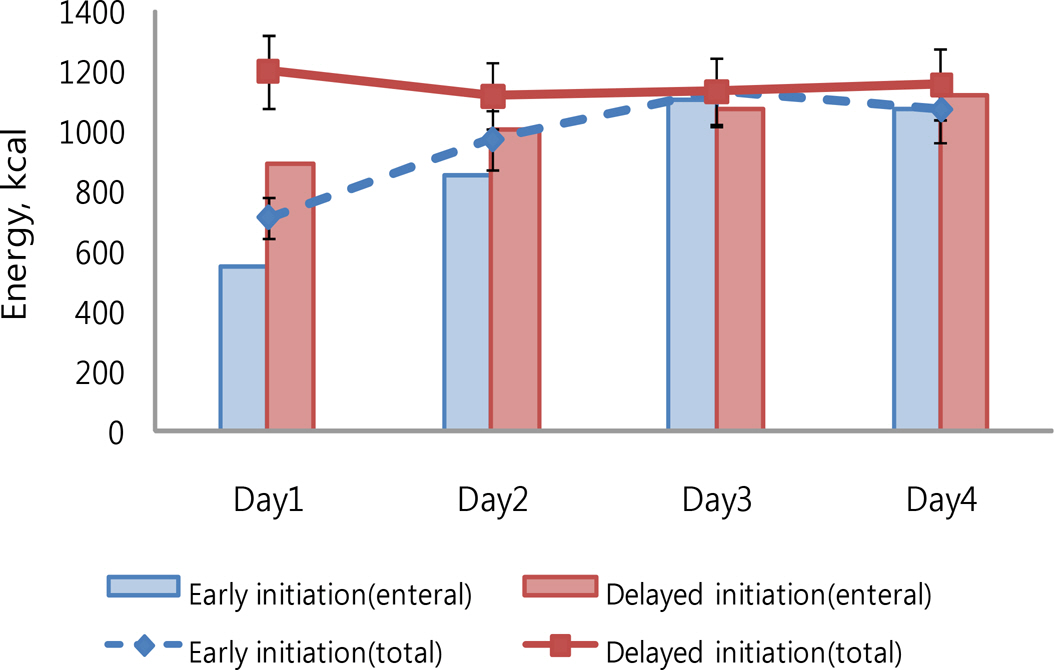
Interaction between Energy received in the Early and Delayed Nutrition Group and Time (N=45)
| Variables | Categories | Early nutrition (n=23) | Delayed nutrition (n=22) | Between group | Within group | |
|---|---|---|---|---|---|---|
| Group | Time | Time×Group | ||||
| M±SD (kcal) | M±SD (kcal) | F (p) |
F (p) |
F (p) |
||
| Energy received (total) | Day1 | 714±236 | 1,203±422 | 13.89 (.001) | 0.90 (.455) | 5.59 (.004) |
| Day2 | 921±282 | 1,122±402 | ||||
| Day3 | 1,132±189 | 1,136±243 | ||||
| Day4 | 1,075±263 | 1,160±242 | ||||
| Mean | 958±161 | 1,165±189 | ||||
| Energy received (enteral) | Day1 | 548±124 | 893±201 | 4.54 (.041) | 1.71 (.187) | 2.60 (.057) |
| Day2 | 854±234 | 1,003±259 | ||||
| Day3 | 1,103±177 | 1,071±236 | ||||
| Day4 | 1,075±263 | 1,116±237 | ||||
| Mean | 892±160 | 1,012±178 | ||||
| Energy required | 1,228±230 | 1,377±317 | ||||
†Controlling for APACHE II scores.
Comparison of Under- and Adequate Feeding in the Early and Delayed Enteral Nutrition Group (N=45)
| Variables | Early nutrition (n=23) | Delayed nutrition (n=22) | x2† | p |
|---|---|---|---|---|
| n (%) | n (%) | |||
| Underfeeding | 17 (73.9) | 11 (50.0) | 2.76 | .089 |
| Adequate feeding | 6 (26.1) | 11 (50.0) |
†Controlling for APACHE II scores.
APACHE II=acute physiology chronic health evaluation II; CRP=C-reactive protein; BMI=body mass index.
Controlling for APACHE II scores.
Controlling for APACHE II scores.
 E-SUBMISSION