1College of Nursing, Korea University, Seoul
2Department of Informational Statistics, Hoseo University, Cheonan
3College of Medicine, Korea University, Seoul
4Graduate School, College of Nursing, Korea University, Seoul, Korea
© 2013 Korean Society of Adult Nursing
This is an Open Access article distributed under the terms of the Creative Commons Attribution Non-Commercial License (http://creativecommons.org/licenses/by-nc/3.0/) which permits unrestricted non-commercial use, distribution, and reproduction in any medium, provided the original work is properly cited.
SDE=standardized direct effect; SIE=Standardized indirect effect; STE=standardized total effect; P_BMD_K=personal bone mineral density knowledge; GOK=general osteoporosis knowledge; PT=perceived threats; RB=relative benefits; OSE=osteoporosis self-efficacy; HM=health motivation; OPHB=osteoporosis preventive health behavior, SMC=squared multiple correlation. ∗p<.10; ∗∗p<.05; ∗∗∗p<.001,

General Characteristics of Participants and Mean Differences of Research Variables
| Characteristics | Categories | n (%) | GOK | PT | RB | OSE | HM | OPHB | ||||||
|---|---|---|---|---|---|---|---|---|---|---|---|---|---|---|
| M±SD | F (p) | M±SD | F (p) | M±SD | F (p) | M±SD | F (p) | M±SD | F (p) | M±SD | F (p) | |||
| Age (year) | ≤50 | 37 (22.8) | 17.49±2.19 | 1.63 | 36.22±7.27 | 0.39 | 13.95±9.00 | 1.53 | 114.24±39.55 | 0.99 | 19.78±3.79 | 3.08 | 30.10±6.50 | 3.80 |
| ≥51 | 125 (77.2) | 16.90±2.50 | (.203) | 35.31±7.83 | (.532) | 15.99±8.80 | (.218) | 121.64±39.89 | (.322) | 20.99±3.64 | (.081) | 27.65±7.38 | (.053) | |
| Ed | ≤Middle school | 53 (32.7) | 16.15±2.50 | 6.09 | 36.62±7.65 | 0.83 | 12.04±8.89 | 7.36 | 113.08±39.15 | 1.31 | 20.09±4.07 | 1.20 | 29.35±7.25 | 0.04 |
| High school | 75 (46.3) | 17.31±2.32 | (.003) | 35.08±7.31 | (.438) | 16.53±8.51 | (<.001) | 122.00±40.45 | (.274) | 21.12±3.91 | (.303) | 29.69±6.69 | (.959) | |
| ≥College | 34 (21.0) | 17.82±2.25 | 34.77±8.59 | 18.74±7.98 | 126.15±39.04 | 20.79±2.36 | 29.47±6.33 | |||||||
| SES | Upper | 4 (2.5) | 16.75±0.96 | 1.09 | 28.00±3.56 | 4.20 | 12.75±13.77 | 3.84 | 97.25±59.01 | 4.07 | 21.25±2.99 | 1.57 | 31.00±1.83 | 4.09 |
| Middle | 129 (79.6) | 17.18±2.52 | (.339) | 35.12±7.46 | (.017) | 16.48±8.58 | (.023) | 124.3±38.29 | (.019) | 20.95±3.71 | (.211) | 30.19±6.96 | (.019) | |
| Lower | 29 (17.9) | 16.45±2.13 | 38.35±8.23 | 11.66±8.57 | 103.48±39.95 | 19.62±3.68 | 26.29±5.29 | |||||||
| Job | Housewife | 97 (59.9) | 16.78±2.47 | 3.08 | 34.85±7.13 | 2.19 | 15.26±8.39 | 1.16 | 124.32±38.81 | 1.60 | 20.99±3.69 | 0.09 | 30.04±6.59 | 0.28 |
| Full or part time job | 45 (27.8) | 17.56±2.37 | (.082) | 36.82±7.95 | (.141) | 16.91±8.73 | (.283) | 115.51±38.31 | (.209) | 20.80±3.03 | (.764) | 29.40±7.00 | (.598) | |
| Missing | 20 (12.3) | |||||||||||||
| Mar | Unmarried | 6 (3.7) | 16.50±2.43 | 3.20 | 35.50±9.33 | 0.04 | 14.17±11.75 | 0.92 | 119.67±50.61 | 3.50 | 21.33±3.14 | 3.04 | 28.83±3.06 | 0.60 |
| With spouse | 142 (87.7) | 16.91±2.39 | (.044) | 35.58±7.82 | (.956) | 15.87±8.72 | (.402) | 122.57±39.52 | (.033) | 20.92±3.75 | (.051) | 29.74±6.83 | (.548) | |
| S/D/D | 14 (8.6) | 18.57±2.53 | 34.93±5.99 | 12.64±9.11 | 93.50±29.57 | 18.43±2.74 | 27.71±7.19 | |||||||
| Osteoporosis or osteopenia | Yes | 34 (21.0) | 17.85±2.45 | 2.46 | 37.24±7.98 | 1.18 | 16.68±8.28 | 0.40 | 124.00±39.80 | 1.52 | 21.32±3.57 | 1.06 | 31.56±6.68 | 4.57 |
| No | 126 (77.8) | 16.82±2.39 | (.089) | 35.02±7.64 | (.311) | 15.25±9.05 | (.672) | 119.59±39.81 | (.221) | 20.60±3.73 | (.348) | 29.16±6.63 | (.012) | |
| Missing | 2 (1.2) | |||||||||||||
| Fracture history | Yes | 20 (12.4) | 17.45±2.26 | 0.65 | 37.60±5.10 | 1.68 | 12.25±7.61 | 3.16 | 104.90±38.49 | 3.31 | 19.45±4.11 | 2.70 | 28.10±7.22 | 1.03 |
| No | 142 (87.7) | 16.98±2.47 | (.420) | 35.23±7.96 | (.197) | 15.99±8.95 | (.077) | 122.07±39.67 | (.071) | 20.89±3.62 | (.103) | 29.74±6.70 | (.312) | |
| Parental osteoporotic fracture history | Yes | 35 (21.6) | 17.63±2.24 | 2.38 | 37.94±7.94 | 5.17 | 13.94±7.38 | 1.71 | 112.89±34.26 | 1.26 | 20.57±4.31 | 0.08 | 28.06±5.55 | 2.03 |
| No | 125 (77.2) | 16.91±2.48 | (.125) | 34.66±7.43 | (.024) | 16.14±9.11 | (.191) | 121.43±41.17 | (.263) | 20.77±3.55 | (.783) | 29.90±7.08 | (.157) | |
| Missing | 2 (1.2) | |||||||||||||
Ed=education; Mar=marriage; SES=socioeconomic status; S/D/D=separated/divorced/death; GOK=general osteoporosis knowledge; PT=perceived threats; RB=relative benefits; OSE=osteoporosis self-efficacy; HM=health motivation; OPHB=osteoporosis preventive health behavior.
Mean, Standard Deviations, and Correlations among Variables
| Variables | n (%) or M±SD | P_ BMD_K | GOK | PT | RB | OSE | HM |
|---|---|---|---|---|---|---|---|
| r (p) | r (p) | r (p) | r (p) | r (p) | r (p) | ||
| P_ BMD_K | |||||||
| Know | 117 (72.2) | ||||||
| Do not know | 45 (27.8) | ||||||
| GOK | 17.04±2.44 | -.01 (.905) | |||||
| PT | 35.52±7.69 | -.06 (.449) | -.10 (.219) | ||||
| RB | 15.53±8.86 | -.04 (.614) | -.01 (.945) | -.32 (<.001) | |||
| OSE | 119.95±39.81 | -.03 (.723) | -.05 (.521) | -.15 (.059) | .47 (<.001) | ||
| HM | 20.72±3.70 | -.16 (.040) | -.05 (.507) | -.14 (.067) | .36 (<.001) | .47 (<.001) | |
| OPHB | 29.53±6.76 | -.26 (.001) | -.07 (.374) | -.08 (.329) | .37 (<.001) | .47 (<.001) | .35 (<.001) |
P_BMD_K=personal bone mineral density knowledge; BMD=bone mineral density; GOK=general osteoporosis knowledge; PT=perceived threats; RB=relative benefits; OSE=osteoporosis self-efficacy; HM=health motivation; OPHB=osteoporosis preventive health behavior.
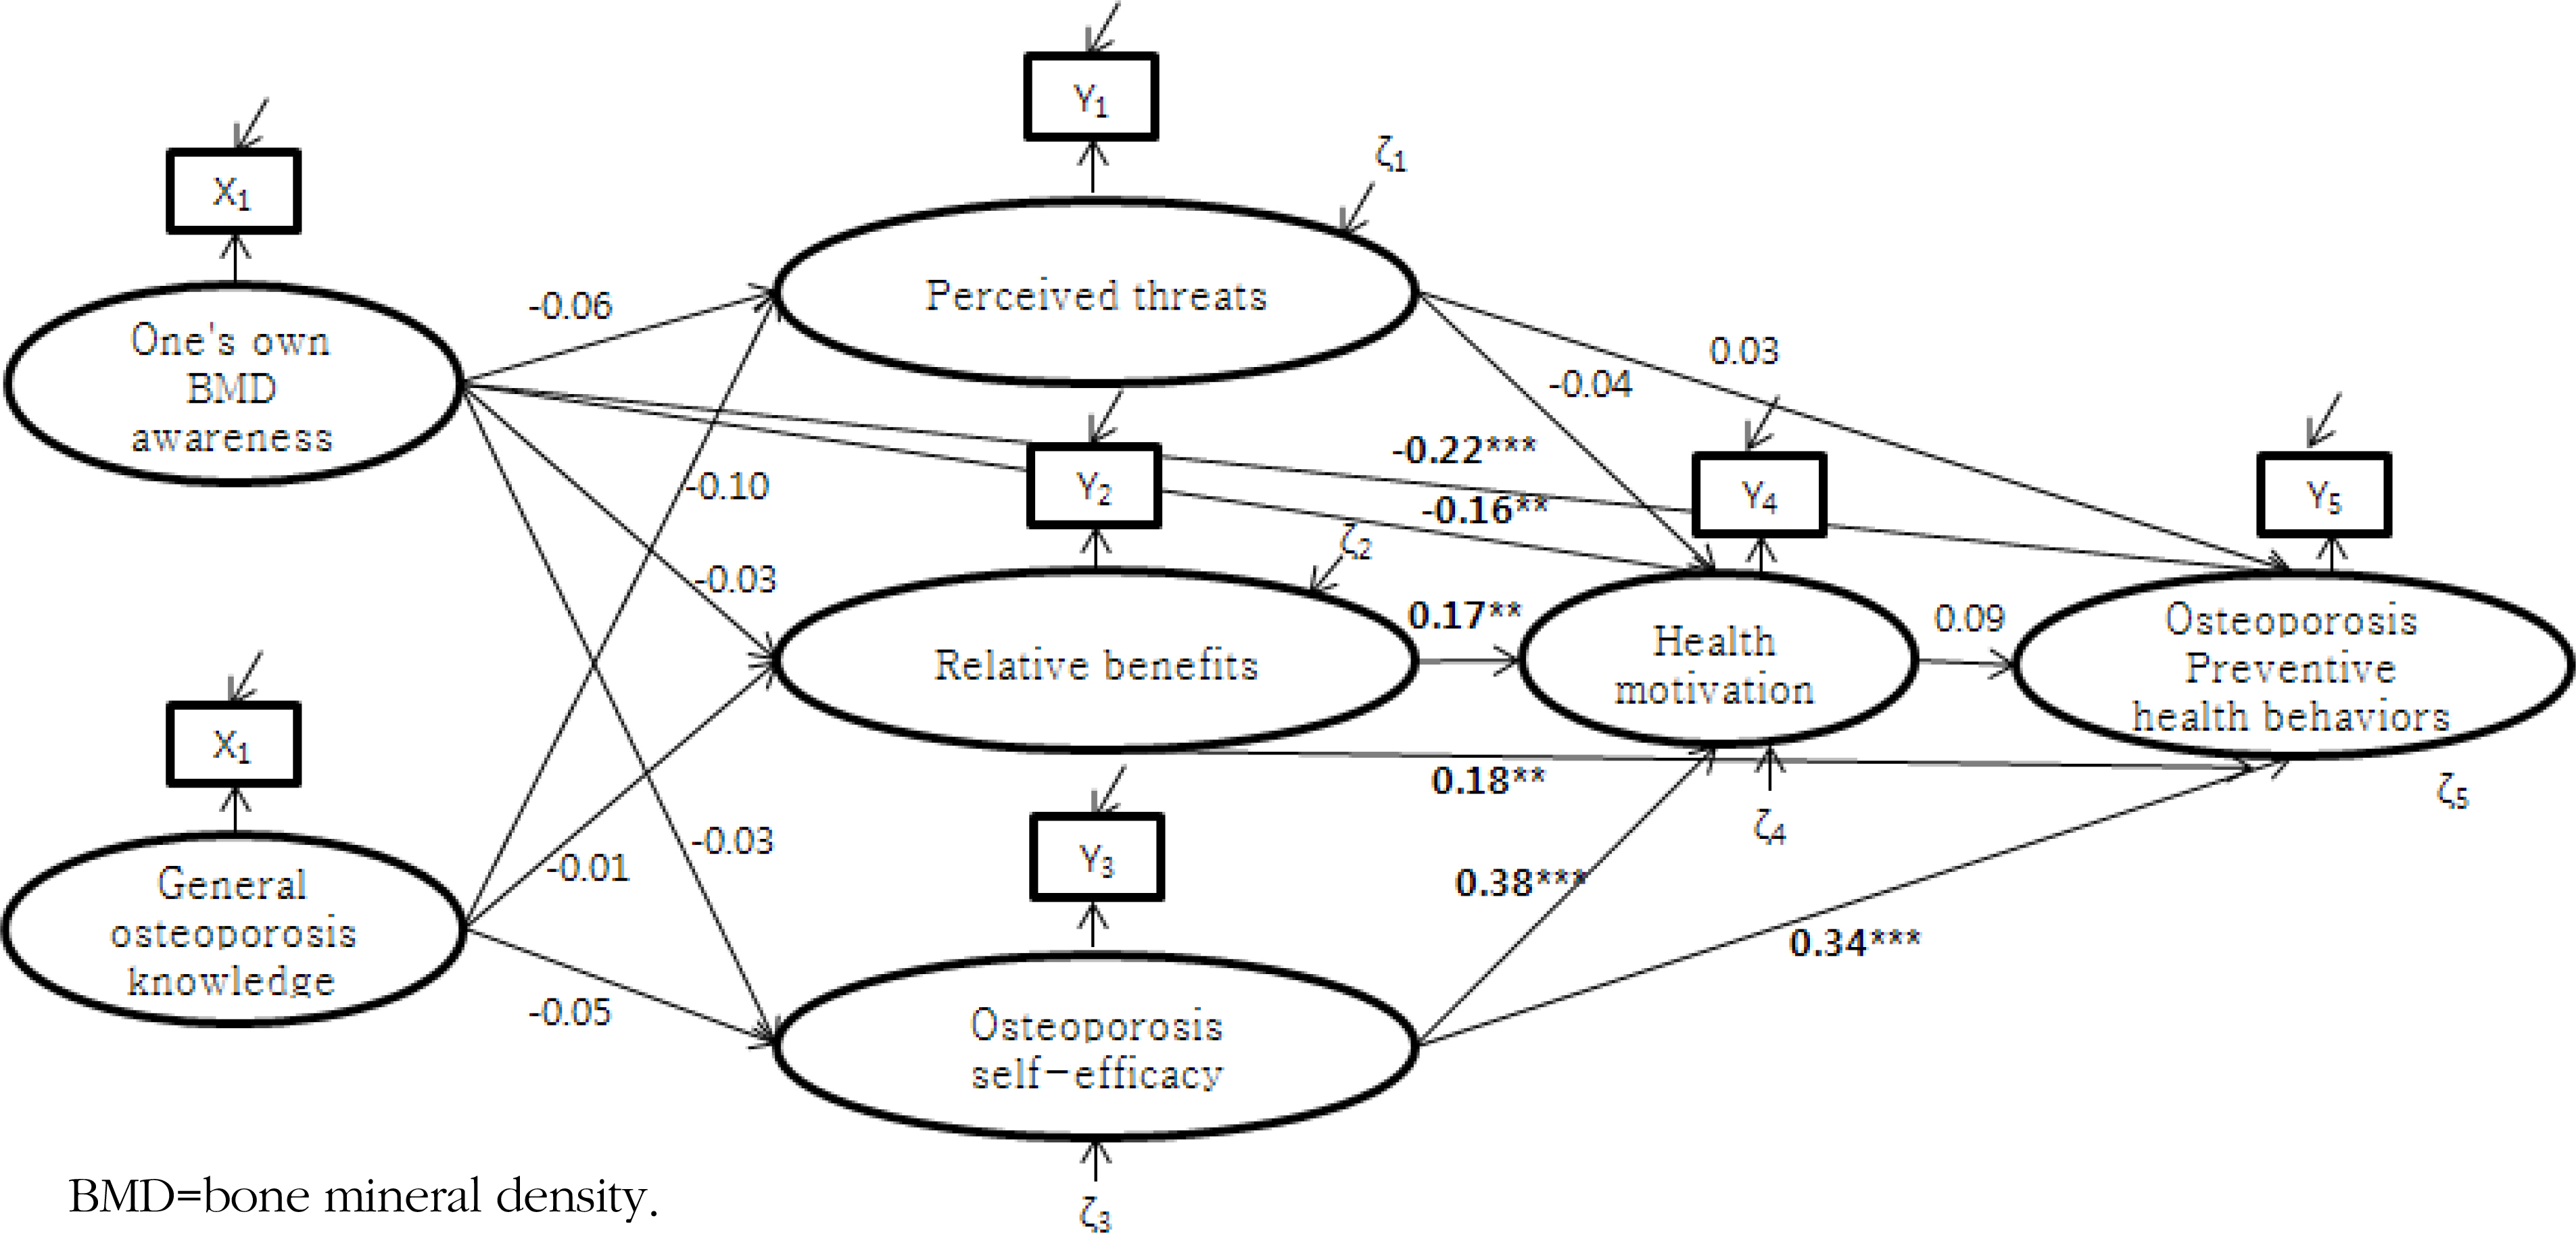
Effects of Predictive Variables on Endogenous Variables in Hypothetical and Revised Model
| Endogenous variables | Exogenous variables | Hypothetical model | Revised model | ||||||
|---|---|---|---|---|---|---|---|---|---|
| SDE | SIE | STE | SMC (R2) | SDE | SIE | STE | SMC (R2) | ||
| OPHB | P_BMD_K | - | -.02 | -.02 | .264 | -.22∗∗∗ | -.03 | -.26∗∗∗ | .312 |
| GOK | - | -.03 | -.03 | - | -.02 | -.02 | |||
| PT | .05 | -.00 | .04 | .03 | -.00 | .03 | |||
| RB | .18∗∗ | .02 | .21∗∗ | .18∗∗ | .02 | .19∗∗ | |||
| OSE | .33∗∗∗ | .05∗ | .38∗∗∗ | .34∗∗∗ | .04 | .37∗∗∗ | |||
| HM | .14∗ | - | .14∗ | .09 | - | .09 | |||
| HM | P_BMD_K | - | -.02 | -.02 | .249 | -.16∗∗ | -.02 | -.17∗∗ | .273 |
| GOK | - | -.02 | -.02 | - | -.02 | -.02 | |||
| PT | -.03 | - | -.03 | -.04 | - | -.04 | |||
| RB | .18∗∗ | - | .18∗∗ | .17∗∗ | - | .17∗∗ | |||
| OSE | .38∗∗∗ | - | .38∗∗∗ | .38∗∗∗ | - | .38∗∗∗ | |||
| OSE | P_BMD_K | -.03 | - | -.03 | .004 | -.03 | - | -.03 | .004 |
| GOK | -.05 | - | -.05 | -.05 | - | -.05 | |||
| RB | P_BMD_K | -.03 | - | -.03 | .001 | -.03 | - | -.03 | .001 |
| GOK | -.01 | - | -.01 | -.01 | - | -.01 | |||
| PT | P_BMD_K | -.06 | - | -.06 | .013 | -.06 | - | -.06 | .013 |
| GOK | -.10 | - | -.10 | -.10 | - | -.10 | |||
SDE=standardized direct effect; SIE=Standardized indirect effect; STE=standardized total effect; P_BMD_K=personal bone mineral density knowledge; GOK=general osteoporosis knowledge; PT=perceived threats; RB=relative benefits; OSE=osteoporosis self-efficacy; HM=health motivation; OPHB=osteoporosis preventive health behavior, SMC=squared multiple correlation. ∗p<.10; ∗∗p<.05; ∗∗∗p<.001,
Ed=education; Mar=marriage; SES=socioeconomic status; S/D/D=separated/divorced/death; GOK=general osteoporosis knowledge; PT=perceived threats; RB=relative benefits; OSE=osteoporosis self-efficacy; HM=health motivation; OPHB=osteoporosis preventive health behavior.
P_BMD_K=personal bone mineral density knowledge; BMD=bone mineral density; GOK=general osteoporosis knowledge; PT=perceived threats; RB=relative benefits; OSE=osteoporosis self-efficacy; HM=health motivation; OPHB=osteoporosis preventive health behavior.
SDE=standardized direct effect; SIE=Standardized indirect effect; STE=standardized total effect; P_BMD_K=personal bone mineral density knowledge; GOK=general osteoporosis knowledge; PT=perceived threats; RB=relative benefits; OSE=osteoporosis self-efficacy; HM=health motivation; OPHB=osteoporosis preventive health behavior, SMC=squared multiple correlation. ∗
 E-SUBMISSION