1Department of Nursing, Kkottongnae University, Chungju
2Collegeof Nursing, ChungnamNational University, Daejeon, Korea
Copyright © 2015 Korean Society of Adult Nursing
This is an Open Access article distributed under the terms of the Creative Commons Attribution Non-Commercial License (http://creativecommons.org/licenses/by-nc/3.0) which permits unrestricted non-commercial use, distribution, and reproduction in any medium, provided the original work is properly cited.


General Characteristics of the Subjects (N=342)
| Characteristics | Categories n | n (%) or M±SD |
|---|---|---|
| Age (year) | 55.18±4.15 | |
| 45~49 | (4.1) 14 | |
| 50~59 | (77.5) 265 | |
| 60~64 | (18.4) 63 | |
| Age at menopause (year) | 51.10±2.89 | |
| Marital status | Single | 5 (1.5) |
| Married | 306 (89.5) | |
| Divorced/separated | 6 (1.8) | |
| Widowed | 25 (7.3) | |
| Level of education | High school ≤ | 213 (62.3) |
| College ≥ | 129 (37.7) | |
| Household income (10,000 won/ month) | 372.40±226.55 | |
| 100 ≤ | 40 (11.7) | |
| 101~200 | 63 (18.4) | |
| 201~300 | 72 (21.1) | |
| 301~400 | 51 (14.9) | |
| 400 > | 116 (33.9) | |
| Occupation | Yes | 201 (58.8) |
| No | 141 (41.2) | |
| Coffee intake | Yes | 271 (79.2) |
| No | 71 (20.8) | |
| Alcohol drinking | Yes | 25 (7.3) |
| No | 317 (92.7) | |
| Smoking | Yes | 5 (1.5) |
| No | 337 (98.5) | |
| Having chronic illness | Yes | 123 (36.0) |
| No | 219 (64.0) | |
| Taking calcium supplement | Yes | 158 (46.2) |
| No | 184 (53.8) | |
| Taking hormone treatment | Yes | 18 (5.3) |
| No | 324 (94.7) |
Descriptive Statistics and Relationships among Study Variables for Osteoporosis Prevention Behaviors (N=342)
| Variables | Range | n (%) or M±SD | X1 | X2 | Y1 | Y2 | Y3 | Y4 | Y5 | Y6 | Y7 |
|---|---|---|---|---|---|---|---|---|---|---|---|
| Level of education (X1) | High school ≤ | 213 (62.3) | 1 | ||||||||
| College ≥ | 129 (37.7) | ||||||||||
| Knowledge about osteoporosis prevention (X2) | 31~124 | 85.53±16.66 | .24 | 1 | |||||||
| (.001) < | |||||||||||
| Perceived benefits minus barriers (Y1) | 0~24 | 0.72±0.70 | .13 | .31 | 1 | ||||||
| (.015) | (.001) < | ||||||||||
| Perceived self efficacy (Y2) | 12~60 | 39.81±7.77 | .14 | .40 | .45 | 1 | |||||
| (.013) | (.001) < | (.001) < | |||||||||
| Health motivation (Y3) | 6~30 | 19.94±4.09 | .20 | .30 | .33 | .35 | 1 | ||||
| (.001) < | (.001) < | (.001) < | (.001) < | ||||||||
| Perceived susceptibility (Y4) | 6~30 | 16.06±4.23 | -.05 | -.06 | -.17 | -.23 | -.06 | 1 | |||
| (.36) | (.265) | (.002) | (.001) < | (.276) | |||||||
| Perceived severity (Y5) | 6~30 | 16.71±4.36 | -.21 | -.03 | -.10 | -.10 | .05 | .50 | 1 | ||
| (.001) < | (.587) | (.080) | (.058) | (.350) | (.001) < | ||||||
| Prevention behavior: Calcium (Y6) | 4~16 | 5.52±2.39 | .08 | .26 | .31 | .39 | .37 | -.08 | -.02 | 1 | |
| (.137) | (.001) < | (.001) < | (.001) < | (.001) < | (.120) | (.748) | |||||
| Prevention behavior: Exercise (Y7) | 4~16 | 5.19±3.07 | -.01 | .28 | .24 | .41 | .33 | -.16 | -.01 | .39 | 1 |
| (.859) | (.001) < | (.001) < | (.001) < | (.001) < | (.004) | (.847) | (.001) < | ||||
| Prevention behavior: Checkup (Y8) | 3~12 | 2.51±2.50 | .12 | .27 | .30 | .18 | .33 | -.07 | -.04 | .44 | .39 |
| (.023) | (.001) < | (.001) < | (.001) | (.001) < | (.171) | (.476) | (.001) < | (.001) < |
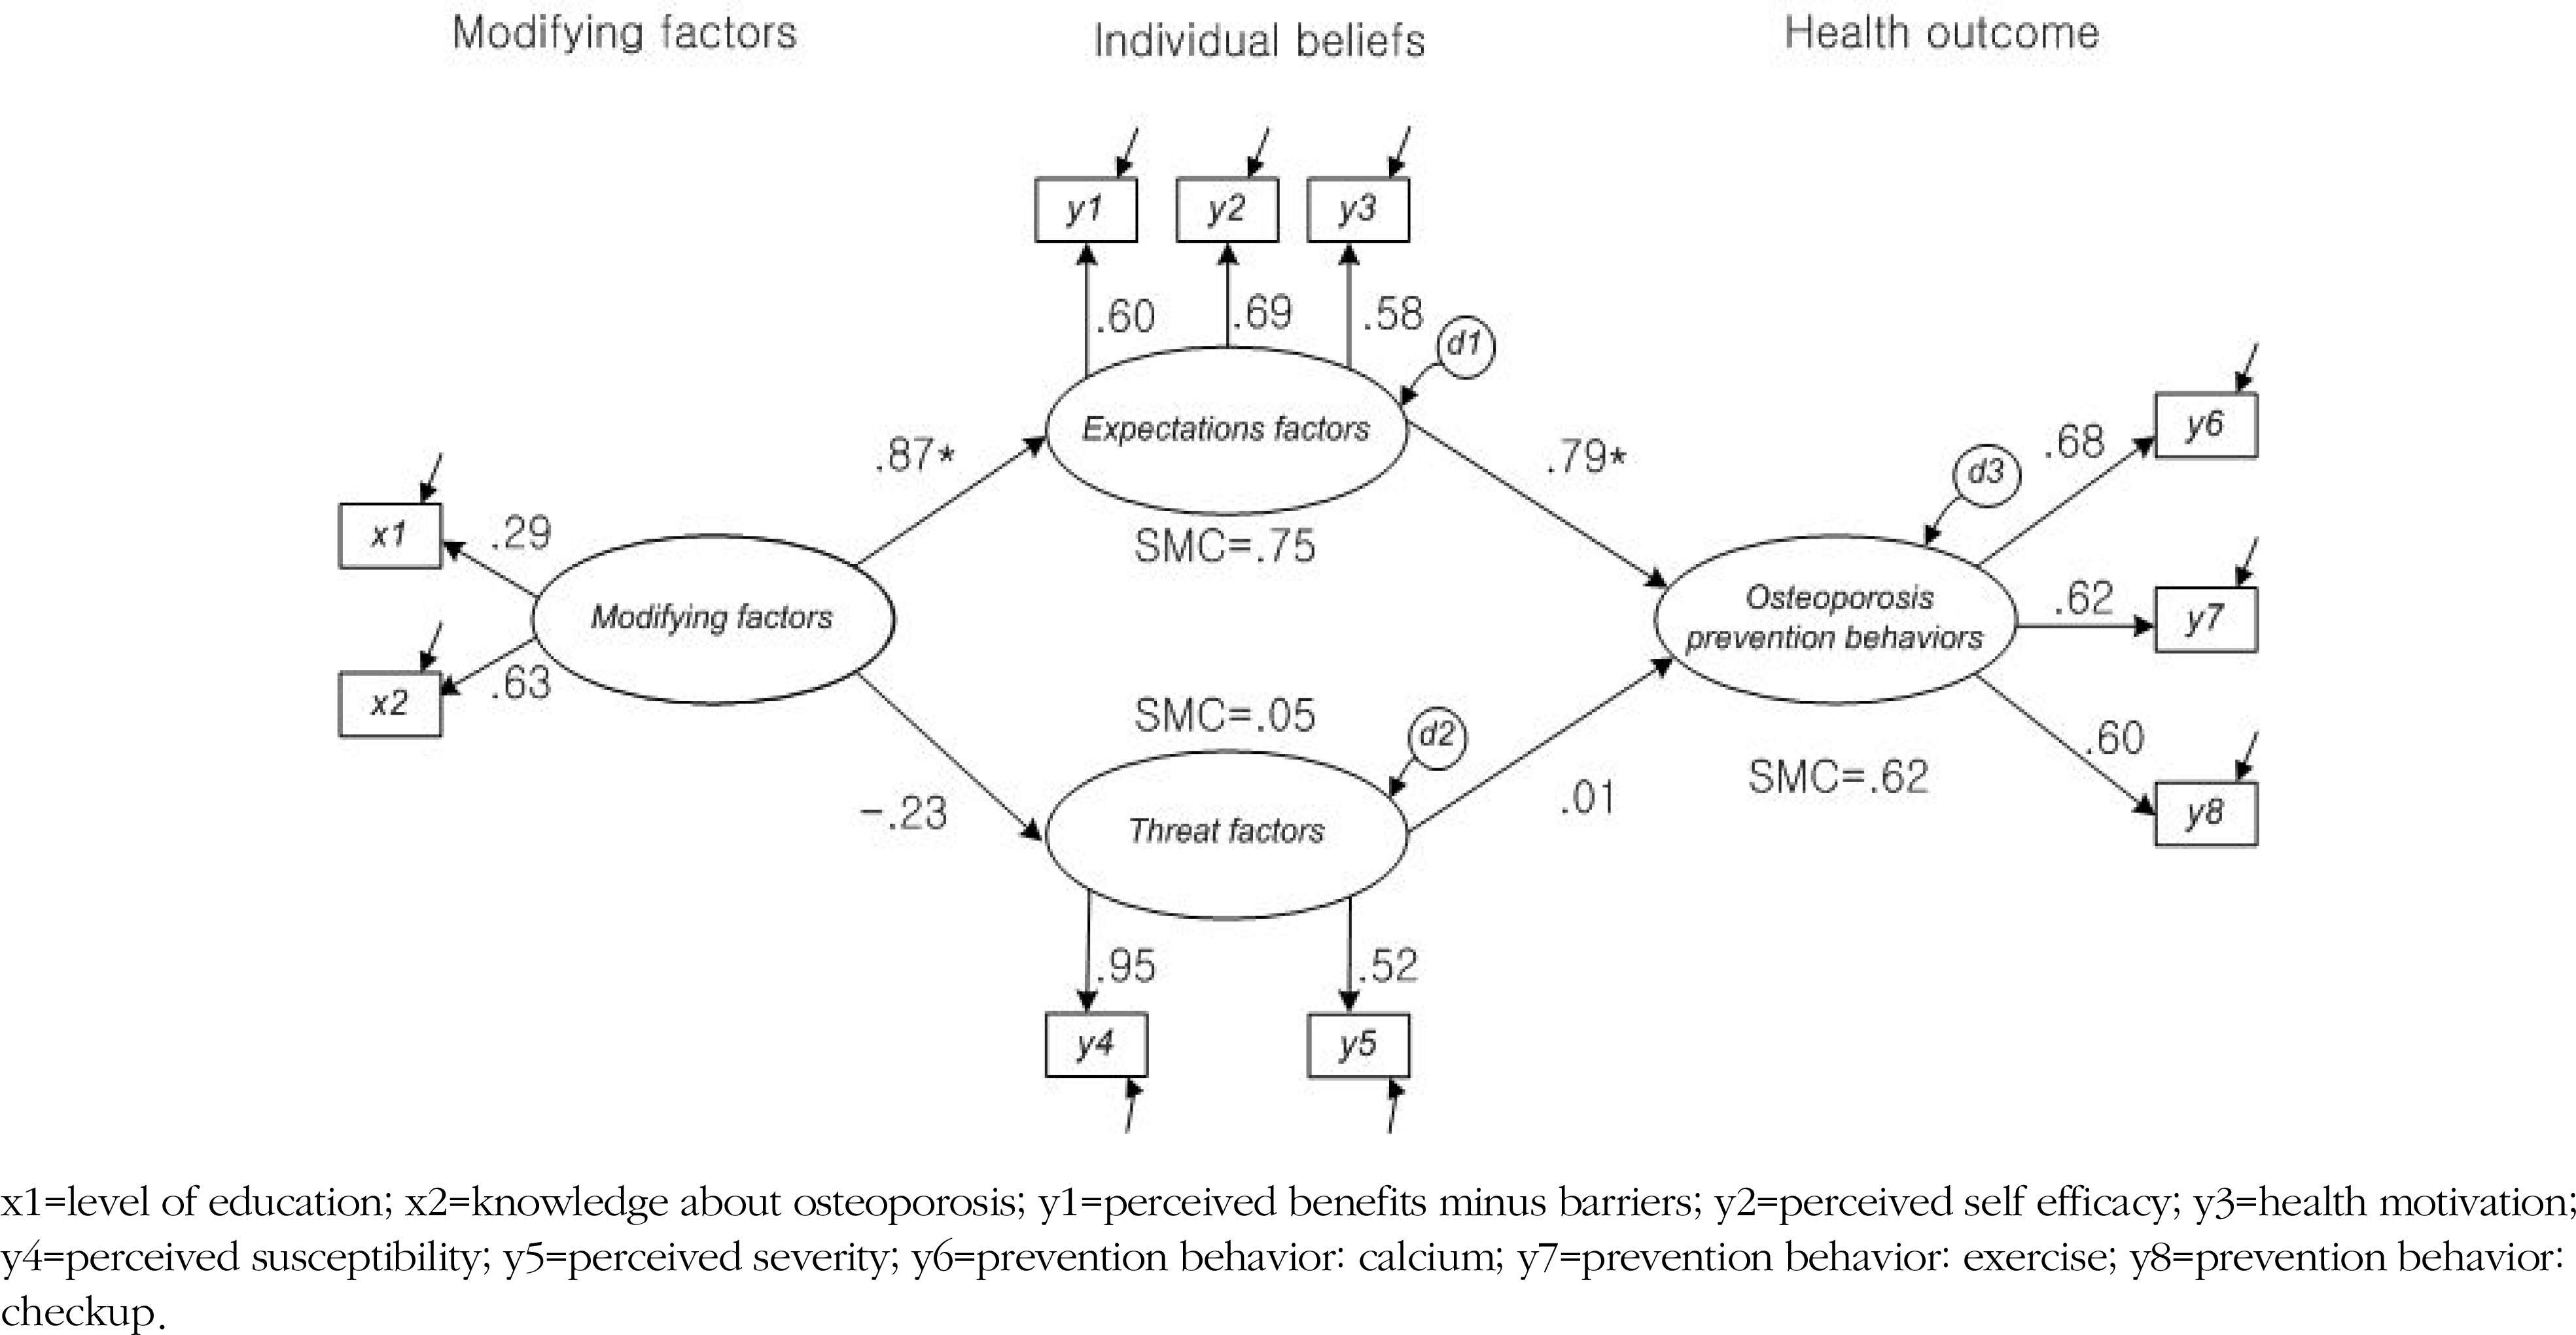
Effects of Explanatory Variables on Osteoporosis Prevention Behaviors (N=342)
| Endogenous variables | Exogenous variables | Standardized coefficient | SMC | ||
|---|---|---|---|---|---|
| Direct effect | Indirect effect | Total effect | |||
| β (p) | β (p) | β (p) | |||
| Osteoporosis | Modifying factors | .79 (.001) < | .68 | .62 | |
| prevention behaviors | Expectations factors | .01 (.924) | .68 (.001) < | .79 | |
| Threat factors | .01 | ||||
| Expectations factors | Modifying factors | .87 (.001) < | .87 | .75 | |
| Threat factors | Modifying factors | -.23 (.130) | -.23 | .05 | |
SMC=squared multiple correlation.
SMC=squared multiple correlation.