

College of Nursing, Kyungpook National University, Daegu, Korea
© 2017 Korean Society of Adult Nursing
This is an open access article distributed under the terms of the Creative Commons Attribution Non-Commercial License (http://creativecommons.org/licenses/ by-nc/3.0), which permits unrestricted non-commercial use, distribution, and reproduction in any medium, provided the original work is properly cited.
| Variables | Step (Path) | B | β | t | p∗ | Adj. R2 | F | p∗∗ |
|---|---|---|---|---|---|---|---|---|
| Mediating effect of self-efficacy | Step 1 (Path c) | .64 | 388.2 | <.001 | ||||
| Outcome: health behaviors | ||||||||
| Predictor: illness perception | 0.87 | .80 | 19.7 | <.001 | ||||
| Step 2 (Path a) | .48 | 199.4 | <.001 | |||||
| Outcome: self-efficacy | ||||||||
| Predictor: illness perception | 0.88 | .69 | 14.1 | <.001 | ||||
| Step 3,4 (Path b and c’) | .66 | 212.4 | <.001 | |||||
| Outcome: health behaviors | ||||||||
| Mediator: self-efficacy (Path b) | 0.17 | .20 | 3.7 | <.001 | ||||
| Predictor: illness perception | 0.72 | .66 | 12.1 | <.001 | ||||
| Sobel test: Z=4.08, p<.001 | ||||||||
| Mediating effect of family support | Step 1 (Path c) | .64 | 388.2 | <.001 | ||||
| Outcome: health behaviors | ||||||||
| Predictor: illness perception | 0.87 | .80 | 19.7 | <.001 | ||||
| Step 2 (Path a) | .55 | 265.0 | <.001 | |||||
| Outcome: family support | ||||||||
| Predictor: illness perception | 0.97 | .74 | 16.3 | <.001 | ||||
| Step 3 (Path b and c’) | .68 | 233.7 | <.001 | |||||
| Outcome: health behaviors | ||||||||
| Mediator: family support (Path b) | 0.26 | .31 | 5.4 | <.001 | ||||
| Predictor: illness perception | 0.62 | .57 | 10.1 | <.001 | ||||
| Sobel tes | st: Z=4.95, | , p<.001 | ||||||

Illness Perception, Health Behaviors, Self-efficacy and Family Support according to Characteristics of Participants (N=219)
| Variables | Categories | n (%) | Illness perception | Self-efficacy | Family support | Health behaviors | ||||
|---|---|---|---|---|---|---|---|---|---|---|
| M± SD | t or F (p) | M± SD | t or F (p) | M± SD | t or F (p) | M± SD | t or F (p) | |||
| Gender | Male | 134 (61.2) | 3.49±0.56 | -3.03 | 3.62±0.74 | -0.40 | 2.62±0.74 | -0.56 | 2.57±0.62 | -4.43 |
| Female | 85 (38.8) | 3.71±0.47 | (.003) | 3.66±0.58 | (.691) | 2.67±0.61 | (.576) | 2.90±0.44 | (<.001) | |
| Age (year) | <50 | 99 (45.2) | 3.60±0.56 | 0.61 | 3.67±0.73 | 0.59 | 2.62±0.72 | -0.36 | 2.67±0.59 | -0.70 |
| ≥50 | 120 (54.8) | 3.55±0.52 | (.544) | 3.61±0.64 | (.559) | 2.67±0.67 | (.718) | 2.72±0.57 | (.484) | |
| Religion | No | 128 (58.4) | 3.46±0.61 | -4.14 | 3.61±0.78 | -0.83 | 2.51±0.76 | -3.76 | 2.55±0.62 | -5.06 |
| Yes | 91 (41.6) | 3.73±0.36 | (<.001) | 3.68±0.52 | (.407) | 2.83±0.55 | (<.001) | 2.91±0.44 | (<.001) | |
| Education | ≤ JHS | 58 (26.5) | 3.41±0.50 | -2.74 | 3.38±0.73 | -3.44 | 2.42±0.77 | -2.70 | 2.56±0.52 | -2.15 |
| ≥ High school | 161 (73.5) | 3.63±0.53 | (.007) | 3.73±0.64 | (.001) | 2.72±0.65 | (.009) | 2.75±0.60 | (.033) | |
| Marital status | Married | 130 (59.4) | 3.61±0.51 | -1.13 | 3.57±0.65 | -1.25 | 2.71±0.64 | -1.82 | 2.77±0.57 | -2.28 |
| Alone | 89 (40.6) | 3.52±0.57 | (.262) | 3.57±0.71 | (.212) | 2.53±0.76 | (.071) | 2.59±0.58 | (.024) | |
| Main caregiver | Family | 175 (79.9) | 3.61±0.49 | 2.54 | 3.68±0.66 | 1.63 | 2.71±0.64 | 6.49 | 2.74±0.57 | 2.80 |
| Self | 38 (17.4) | 3.40±0.69 | (.081) | 3.50±0.80 | (.199) | 2.28±0.85 | (.002) | 2.51±0.65 | (.063) | |
| Others | 6 (2.7) | 3.57±0.53 | 3.36±0.34 | 2.70±0.54 | 2.53±0.20 | |||||
| Occupation | Unemployed | 58 (26.5) | 3.63±0.56 | 0.95 | 3.62±0.70 | -0.25 | 2.79±0.76 | 2.01 | 2.86±0.57 | 2.55 |
| Employed | 161 (73.5) | 3.55±0.52 | (.345) | 3.64±0.68 | (.803) | 2.58±0.66 | (.045) | 2.64±0.57 | (.011) | |
| Comorbidity | None | 116 (53.0) | 3.66±0.53 | 2.70 | 3.73±0.68 | 2.09 | 2.70±0.73 | 1.38 | 2.80±0.59 | 2.73 |
| Yes | 103 (47.0) | 3.47±0.52 | (.007) | 3.54±0.67 | (.038) | 2.57±0.65 | (.168) | 2.59±0.55 | (.007) | |
| Past history of TB | No | 155 (70.8) | 3.60±0.52 | 0.97 | 3.61±0.61 | 2.07 | 2.63±0.70 | 072 | 2.71±0.53 | 0.35 |
| Yes | 45 (20.5) | 3.47±0.65 | (.380) | 3.60±0.88 | (.129) | 2.59±0.80 | (.490) | 2.63±0.79 | (.702) | |
| Trace | 19 (8.7) | 3.60±0.27 | 3.94±0.67 | 2.81±0.44 | 2.74±0.41 | |||||
| Family history of TB | No | 179 (81.7) | 3.54±0.56 | 2.25 | 3.61±0.68 | 1.21 | 2.81±0.61 | 1.79 | 2.66±0.59 | 2.10 |
| Yes | 40 (18.3) | 3.71±0.38 | (.027) | 3.75±0.68 | (.229) | 2.60±0.71 | (.075) | 2.87±0.53 | (.037) | |
| Side effect of TB medication | None | 96 (43.8) | 3.65±0.51 | 1.91 | 3.71±0.62 | 1.34 | 2.78±0.60 | 2.71 | 2.80±0.56 | 2.27 |
| Yes | 123 (56.2) | 3.51±0.55 | (0.58) | 3.58±0.72 | (.182) | 2.53±075 | (.007) | 2.62±0.58 | (.024) | |
| Discontinuation of TB medication | Never | 187 (85.4) | 3.63±0.48 | 3.21 | 3.71±0.58 | 2.67 | 2.71±0.64 | 3.21 | 2.77±0.53 | 3.49 |
| Yes | 32 (14.6) | 3.23±0.69 | (.003) | 3.22±1.01 | (.011) | 2.21±0.83 | (.003) | 2.30±0.72 | (.001) | |
JHS= junior high school; TB=tuberculosis.
Level of Illness Perception, Health Behaviors, Selfefficacy and Family Support (N=219)
| Scales | M± SD | Min~Max |
|---|---|---|
| Illness perception | 3.57±0.53 | 2.25~4.68 |
| Perceived barrier | 3.35±0.84 | 1.44~5.00 |
| Perceived benefit | 3.99±0.65 | 2.42~5.00 |
| Perceived seriousness | 3.14±0.68 | 1.43~5.00 |
| Health behaviors | 2.70±0.58 | 1.29~3.94 |
| Complying with TB medication | 3.28±0.68 | 1.00~4.00 |
| Following healthy diet | 2.44±0.64 | 1.14~3.86 |
| Performing physical exercise | 2.36±0.82 | 1.00~4.00 |
| Maintaining environmental hygiene | 2.53±0.80 | 1.00~4.00 |
| Preventing disease transmission | 2.88±0.76 | 1.25~4.00 |
| Avoiding TB risk factors | 2.84±0.66 | 1.20~4.00 |
| Self-efficacy | 3.64±0.68 | 1.67~5.00 |
| Family support | 2.64±0.70 | 1.06~4.00 |
| Emotional support | 2.47±0.76 | 1.00~4.00 |
| Instrumental support | 2.83±0.81 | 1.00~4.00 |
| Information support | 2.47±0.80 | 1.00~4.00 |
| Appraisal support | 2.83±0.66 | 1.00~4.00 |
TB=tuberculosis.
Relationships among Key Variables (N=219)
| Variables | Health behaviors | Illness perception | Self-efficacy | Family support |
|---|---|---|---|---|
| r (p) | r (p) | r (p) | r (p) | |
| Health behaviors | 1 | |||
| Illness perception | .801 (<.001) | 1 | ||
| Self-efficacy | .660 (<.001) | .692 (<.001) | 1 | |
| Family support | .732 (<.001) | .742 (<.001) | .543 (<.001) | 1 |
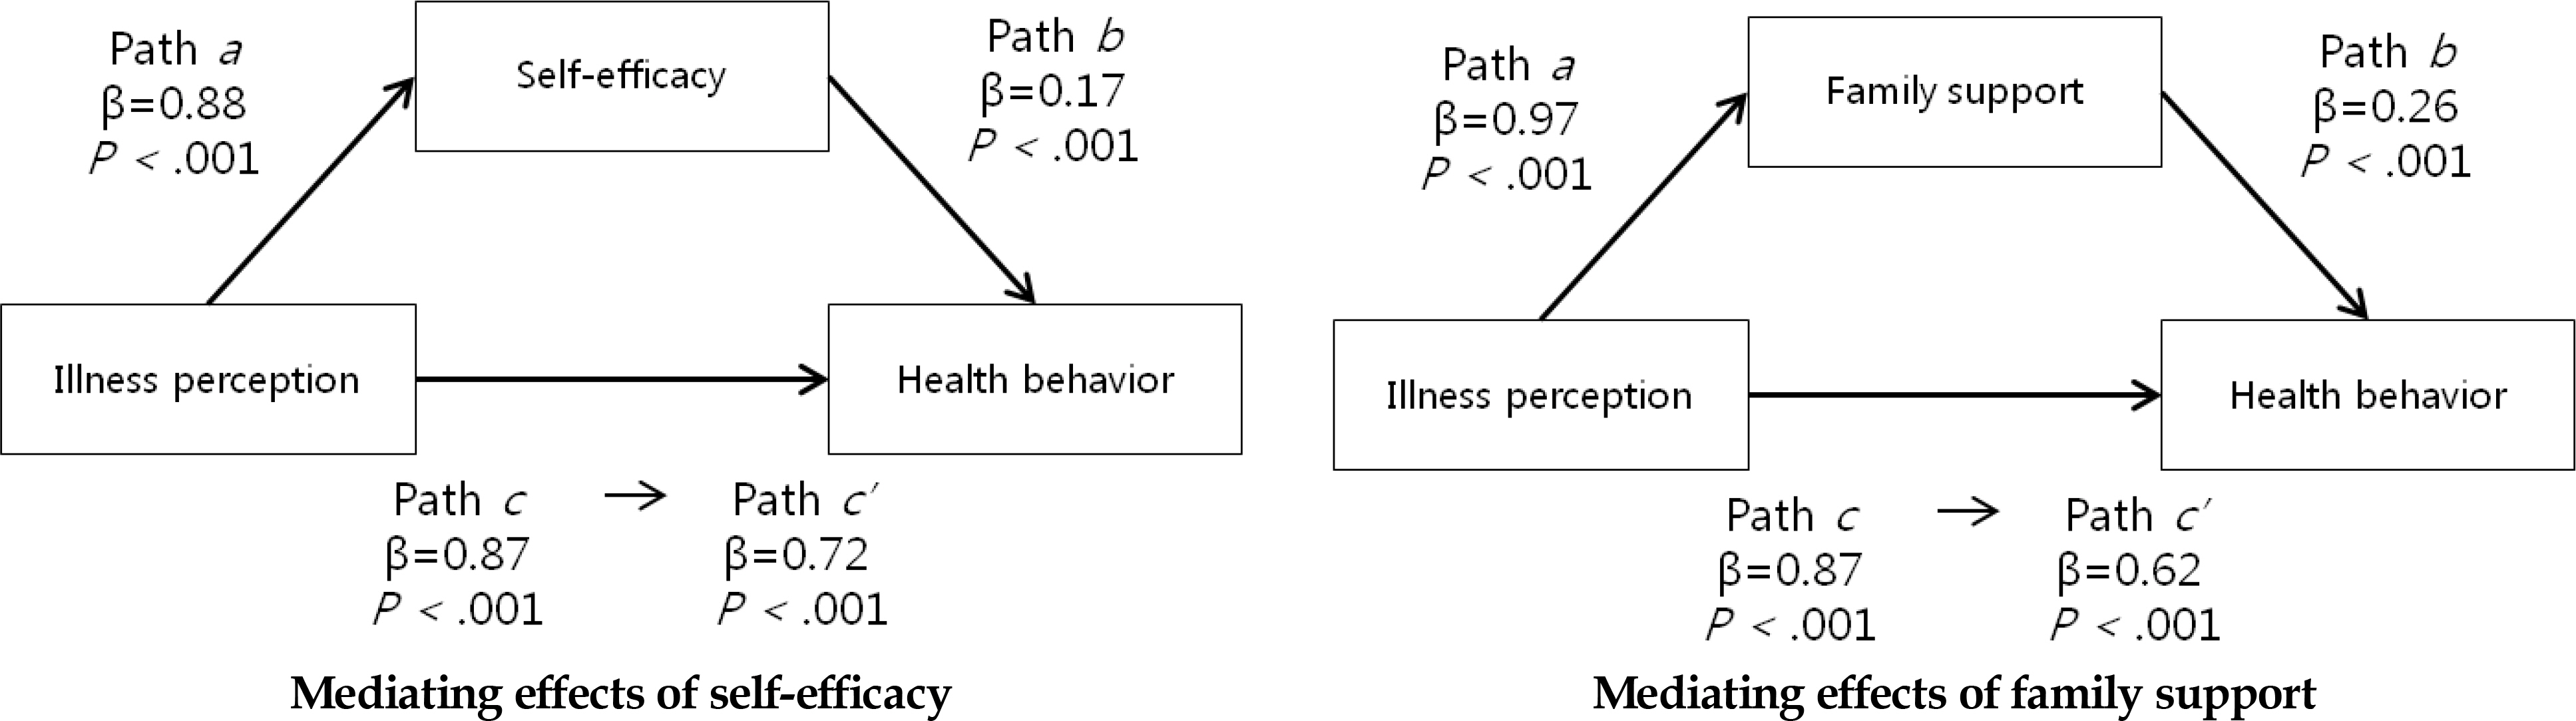
Mediating Effects of Self-Efficacy and Family Support in the Relationship between Illness Perception and Health Behaviors (N=219)
| Variables | Step (Path) | B | β | t | p∗ | Adj. R |
F | p∗∗ |
|---|---|---|---|---|---|---|---|---|
| Mediating effect of self-efficacy | Step 1 (Path c) | .64 | 388.2 | <.001 | ||||
| Outcome: health behaviors | ||||||||
| Predictor: illness perception | 0.87 | .80 | 19.7 | <.001 | ||||
| Step 2 (Path a) | .48 | 199.4 | <.001 | |||||
| Outcome: self-efficacy | ||||||||
| Predictor: illness perception | 0.88 | .69 | 14.1 | <.001 | ||||
| Step 3,4 (Path b and c’) | .66 | 212.4 | <.001 | |||||
| Outcome: health behaviors | ||||||||
| Mediator: self-efficacy (Path b) | 0.17 | .20 | 3.7 | <.001 | ||||
| Predictor: illness perception | 0.72 | .66 | 12.1 | <.001 | ||||
| Sobel test: Z=4.08, p<.001 | ||||||||
| Mediating effect of family support | Step 1 (Path c) | .64 | 388.2 | <.001 | ||||
| Outcome: health behaviors | ||||||||
| Predictor: illness perception | 0.87 | .80 | 19.7 | <.001 | ||||
| Step 2 (Path a) | .55 | 265.0 | <.001 | |||||
| Outcome: family support | ||||||||
| Predictor: illness perception | 0.97 | .74 | 16.3 | <.001 | ||||
| Step 3 (Path b and c’) | .68 | 233.7 | <.001 | |||||
| Outcome: health behaviors | ||||||||
| Mediator: family support (Path b) | 0.26 | .31 | 5.4 | <.001 | ||||
| Predictor: illness perception | 0.62 | .57 | 10.1 | <.001 | ||||
| Sobel tes | st: Z=4.95, | , p<.001 | ||||||
B=unstandardized coefficients; β=standardized coefficients; p∗= p-value of independent variable; p∗∗= p-value of model; Adj. R
2=adjusted R-squared.
JHS= junior high school; TB=tuberculosis.
TB=tuberculosis.
B=unstandardized coefficients; β=standardized coefficients; =adjusted R-squared.
 E-SUBMISSION
