1Chungnam National University Hospital, Daejeon, Korea
2College of Nursing, Chungnam National University, Daejeon, Korea
© 2018 Korean Society of Adult Nursing
This is an open access article distributed under the terms of the Creative Commons Attribution Non-Commercial License (http://creativecommons.org/licenses/ by-nc/3.0), which permits unrestricted non-commercial use, distribution, and reproduction in any medium, provided the original work is properly cited.
| Variables | Categories | Comparison (n=49) | Intervention I (n=49) | Intervention II (n=45) | x2 | p |
|---|---|---|---|---|---|---|
| n (%) or M± SD | n (%) or M± SD | n (%) or M± SD | ||||
| Past experience of fall | Yes | 18 (36.7) | 17 (34.7) | 10 (22.2) | 2.65 | .266 |
| No | 31 (63.3) | 32 (65.3) | 35 (77.8) | |||
| On IV therapy | Yes | 39 (79.6) | 35 (71.4) | 28 (62.2) | 3.46 | .177 |
| No | 10 (20.4) | 14 (2836) | 17 (37.8) | |||
| Nursing unit | Medicine | 27 (55.1) | 27 (55.1) | 27 (60.0) | 0.30 | .860 |
| Surgery | 22 (44.9) | 22 (44.9) | 18 (40.0) | |||
| Disease† | Hypertension | 30 (62.1) | 26 (53.1) | 29 (64.4) | 1.40 | .507 |
| Diabetes | 14 (28.6) | 12 (24.5) | 15 (33.3) | 0.90 | .638 | |
| Cancer | 14 (28.6) | 14 (28.6) | 16 (35.6) | 0.71 | .703 | |
| Heart disease | 8 (16.3) | 8 (16.3) | 9 (20.0) | 0.29 | .866 | |
| Spinal problem | 8 (16.3) | 4 (8.2) | 7 (15.6) | 1.71 | .425 | |
| Respiratory disease | 6 (12.2) | 2 (4.1) | 4 (8.9) | 2.14 | .335‡ | |
| Osteoporosis | 4 (8.2) | 2 (4.1) | 3 (6.7) | 2.52 | .811‡ | |
| Number of medications taking that affects fall | ≤1 | 32 (65.3) | 38 (77.6) | 26 (57.8) | 5.72 | .217 |
| 2~3 | 14 (28.6) | 8 (16.3) | 17 (37.8) | |||
| ≥4 | 3 (6.1) | 3 (6.1) | 2 (4.4) | |||
| MFS score | No risk | 12 (24.5) | 24 (49.0) | 14 (31.1) | 7.17 | .127 |
| Low risk | 26 (53.1) | 19 (38.8) | 23 (51.1) | |||
| High risk | 11 (22.4) | 6 (12.2) | 8 (17.8) |
| Variables | Comparison (n=49)a | Intervention I (n=49)b | Intervention II (n=45)c | F | p | Scheffé |
|---|---|---|---|---|---|---|
| M± SD | M± SD | M± SD | ||||
| Fall attitude | 2.73±0.59 | 3.11±0.59 | 3.17±0.62 | 16.05† | <.001 | a< b, c |
| Fall prevention behavior | 2.52±0.87 | 2.97±0.09 | 3.30±0.90 | 19.83† | <.001 | a< b< c |
| Satisfaction with education | 3.15±1.12 | 4.46±0.12 | 4.40±0.12 | 40.02† | <.001 | a< b, c |

Homogeneity Test of General Characteristics among Groups (N=143)
| Variables | Categories | Comparison (n=49) | Intervention I (n=49) | Intervention II (n=45) | x2 or F | p |
|---|---|---|---|---|---|---|
| n (%) or M± SD | n (%) or M± SD | n (%) or M± SD | ||||
| Age (year) | 65~70 | 15 (30.6) | 19 (38.8) | 14 (31.1) | 3.02 | .554 |
| 71~80 | 29 (59.2) | 24 (49.0) | 22 (48.9) | |||
| ≥81 | 5 (10.2) | 6 (12.2) | 9 (20.0) | |||
| 73.6±5.02 | 73.5±5.80 | 74.8±6.66 | 0.71 | .492 | ||
| Gender | Male | 21 (42.9) | 23 (46.9) | 18 (40.0) | 0.47 | .792 |
| Female | 28 (57.1) | 26 (53.1) | 27 (60.0) | |||
| Education level | ≤ Junior high school | 36 (73.5) | 33 (67.3) | 33 (73.3) | 0.58 | .749 |
| ≥ High school | 13 (26.5) | 16 (32.7) | 12 (26.7) | |||
| Spouse | Yes | 39 (79.6) | 37 (75.5) | 37 (82.2) | 1.65 | .722 |
| No | 10 (20.4) | 12 (24.5) | 8 (17.8) | |||
| Caregiver | Spouse | 17 (34.7) | 17 (34.7) | 14 (31.1) | 0.70 | .951 |
| Others | 21 (42.9) | 19 (38.8) | 13 (26.5) | |||
| Alone | 1 (22.4) | 13 (26.5) | 10 (22.2) | |||
| Using bed at home | Yes | 22 (44.9) | 28 (57.1) | 20 (44.4) | 2.00 | .367 |
| No | 27 (55.1) | 21 (42.9) | 25 (55.6) |
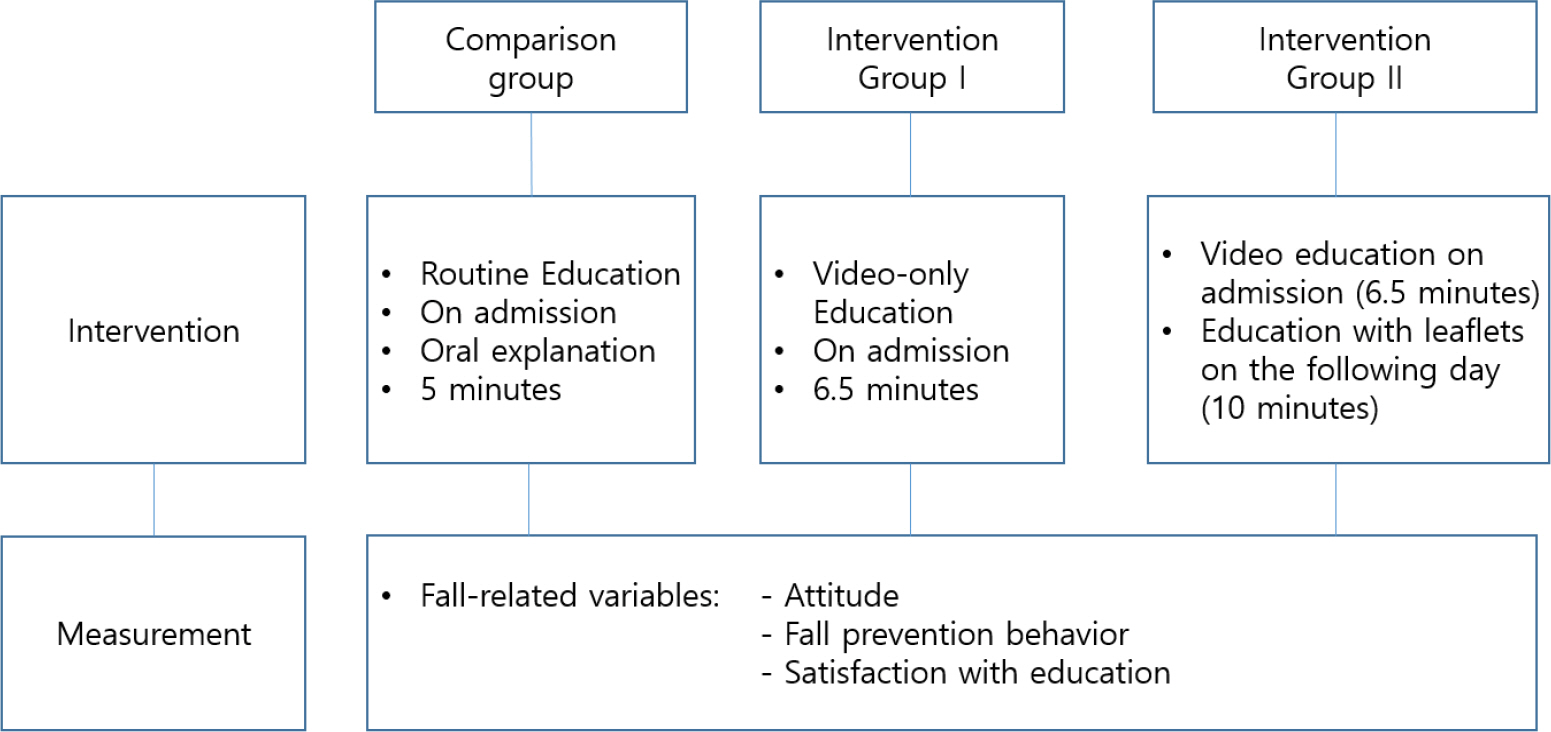
Comparison=routine education; Intervention I=video only education; Intervention II=video plus leaflets education.
Homogeneity Test of Disease Characteristics among Groups (N=143)
| Variables | Categories | Comparison (n=49) | Intervention I (n=49) | Intervention II (n=45) | x2 | p |
|---|---|---|---|---|---|---|
| n (%) or M± SD | n (%) or M± SD | n (%) or M± SD | ||||
| Past experience of fall | Yes | 18 (36.7) | 17 (34.7) | 10 (22.2) | 2.65 | .266 |
| No | 31 (63.3) | 32 (65.3) | 35 (77.8) | |||
| On IV therapy | Yes | 39 (79.6) | 35 (71.4) | 28 (62.2) | 3.46 | .177 |
| No | 10 (20.4) | 14 (2836) | 17 (37.8) | |||
| Nursing unit | Medicine | 27 (55.1) | 27 (55.1) | 27 (60.0) | 0.30 | .860 |
| Surgery | 22 (44.9) | 22 (44.9) | 18 (40.0) | |||
| Disease |
Hypertension | 30 (62.1) | 26 (53.1) | 29 (64.4) | 1.40 | .507 |
| Diabetes | 14 (28.6) | 12 (24.5) | 15 (33.3) | 0.90 | .638 | |
| Cancer | 14 (28.6) | 14 (28.6) | 16 (35.6) | 0.71 | .703 | |
| Heart disease | 8 (16.3) | 8 (16.3) | 9 (20.0) | 0.29 | .866 | |
| Spinal problem | 8 (16.3) | 4 (8.2) | 7 (15.6) | 1.71 | .425 | |
| Respiratory disease | 6 (12.2) | 2 (4.1) | 4 (8.9) | 2.14 | .335 |
|
| Osteoporosis | 4 (8.2) | 2 (4.1) | 3 (6.7) | 2.52 | .811 |
|
| Number of medications taking that affects fall | ≤1 | 32 (65.3) | 38 (77.6) | 26 (57.8) | 5.72 | .217 |
| 2~3 | 14 (28.6) | 8 (16.3) | 17 (37.8) | |||
| ≥4 | 3 (6.1) | 3 (6.1) | 2 (4.4) | |||
| MFS score | No risk | 12 (24.5) | 24 (49.0) | 14 (31.1) | 7.17 | .127 |
| Low risk | 26 (53.1) | 19 (38.8) | 23 (51.1) | |||
| High risk | 11 (22.4) | 6 (12.2) | 8 (17.8) |
Comparison=routine education; Intervention I=video only education; Intervention II=video plus leaflets education; IV=Intravenous;
MFS=Morse Fall Scale;
†Multiple response,
‡Fisher's exact test.
Effects of Fall Prevention Education Program on Outcome Variables among Groups (N=143)
| Variables | Comparison (n=49)a | Intervention I (n=49)b | Intervention II (n=45)c | F | p | Scheffé |
|---|---|---|---|---|---|---|
| M± SD | M± SD | M± SD | ||||
| Fall attitude | 2.73±0.59 | 3.11±0.59 | 3.17±0.62 | 16.05 |
<.001 | a< b, c |
| Fall prevention behavior | 2.52±0.87 | 2.97±0.09 | 3.30±0.90 | 19.83 |
<.001 | a< b< c |
| Satisfaction with education | 3.15±1.12 | 4.46±0.12 | 4.40±0.12 | 40.02 |
<.001 | a< b, c |
Comparison=routine education; Intervention I=video only education; Intervention II=video plus leaflets education;
†F score after controlling age and education.
Comparison=routine education; Intervention I=video only education; Intervention II=video plus leaflets education.
Comparison=routine education; Intervention I=video only education; Intervention II=video plus leaflets education; IV=Intravenous; MFS=Morse Fall Scale; Multiple response, Fisher's exact test.
Comparison=routine education; Intervention I=video only education; Intervention II=video plus leaflets education; F score after controlling age and education.
 E-SUBMISSION